XM does not provide services to residents of the United States of America.

Stock Market News

post-image

Technical Analysis – US 500 index rests near new 7-week low

Posted on September 7, 2022 at 6:56 am GMT

The US 500 cash index is in the process to post the fourth consecutive red week as the price failed to surpass the descending trend line and the 200-day simple moving average (SMA). The index is currently recording a new seven-week low near 3,886 with the technical oscillator confirming this view. The RSI is approaching the oversold zone, while the MACD is strengthening its negative momentum below its zero and trigger lines. Should selling pressures intensify, initial support could be [..]

post-image

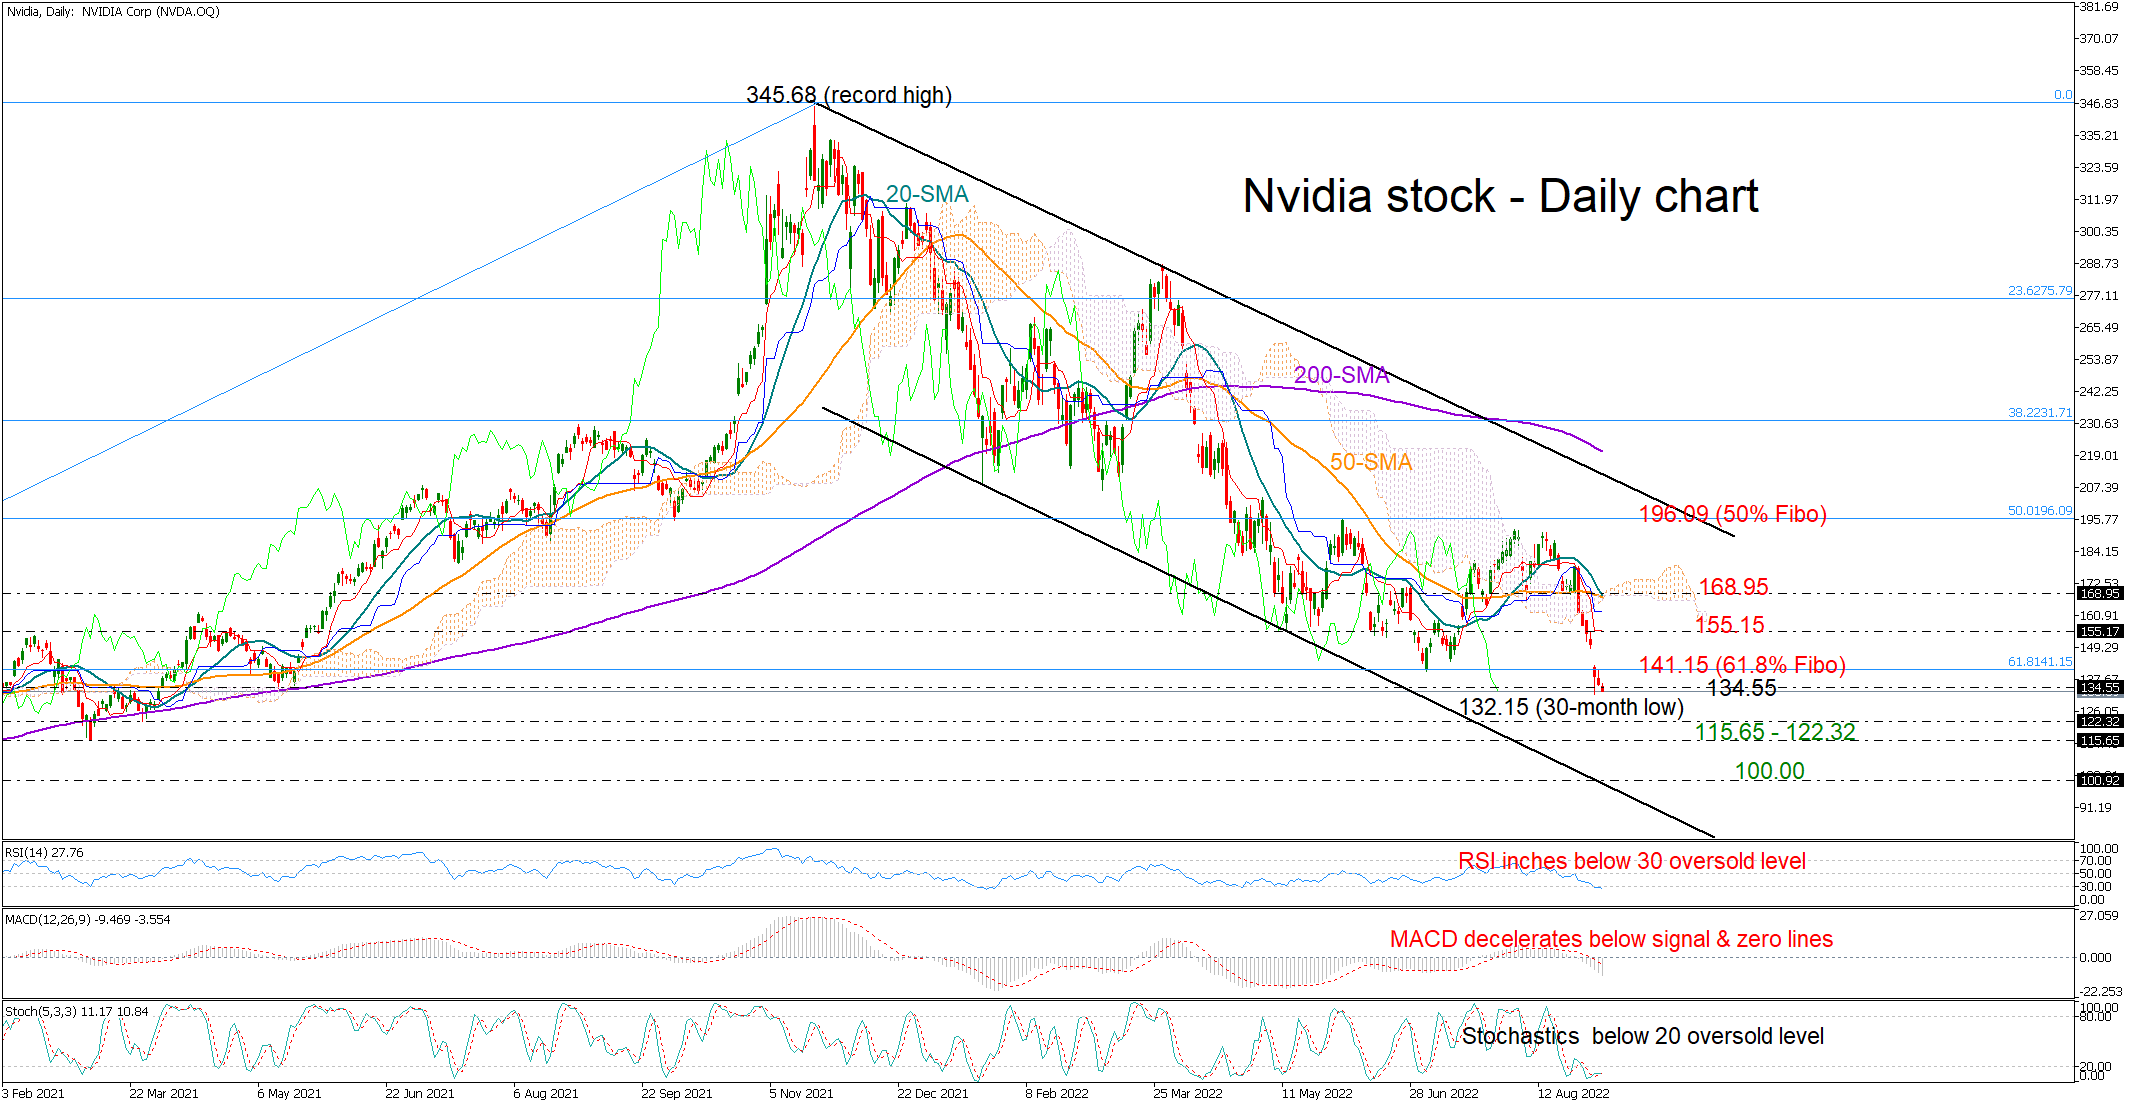
Technical Analysis – Nvidia stock still looks gloomy after 30-month low

Posted on September 6, 2022 at 2:19 pm GMT

Nvidia stock opened the week with a sharp gap lower to hit a 30-month low, ending Monday’s session in the red and slightly below the 61.8% Fibonacci retracement of the 2020 uptrend at 141.15. The price is currently positioned around the May 2021 support area of 134.55, and while oversold signals are strengthening as the RSI is flirting with the 30 level and the stochastics are clearly below 20, a close below that base could prompt a continuation towards the 122.32 [..]

post-image

Technical Analysis – Chevron stock extends uptrend, eyeing crucial zone

Posted on August 30, 2022 at 1:51 pm GMT

Chevron’s stock has been gaining ground in the short-term after its sharp decline came to a halt at the 132.40 region. In addition, the ascending 50- and 200-day simple moving averages (SMAs) combined with the price action being near the upper Bollinger band are promoting a bullish technical picture. The short-term oscillators suggest that near-term risks are tilted to the upside. Specifically, the MACD histogram is currently above both zero and its red signal line, while the RSI is hovering [..]

post-image

Technical Analysis – JP 225 index sees golden cross but strong resistance awaits near 7-month high

Posted on August 30, 2022 at 1:34 pm GMT

The JP 225 cash index has gained little so far this week, and it managed to hold above the 27,730 support. That said, the 20- and the 200-day simple moving averages (SMAs) posted a golden gross, suggesting more gains in the market. The technical indicators are feeding some prospects for a possible positive short-term trading. The RSI is rising well above 50, while the stochastic remains above its oversold territory, even though is flattening. A successful attempt above the seven-month high of [..]

post-image

Technical Analysis – US 100 index rebounds off the uptrend line

Posted on August 30, 2022 at 9:06 am GMT

The US 100 index bounced on the short-term uptrend line, which is taken from the lows on June 16. Also, the 50- and the 100-day simple moving averages are in the process of completing a bullish crossover. The RSI indicator is pointing upwards in the bearish region; however, the MACD oscillator is still falling below its trigger line but keeps fluctuating above the zero level. An extension to the upside may find resistance near the 13,207 barrier before stretching towards the four-month high at 13,721. Slightly higher, the 200-day SMA at 13,800 may next halt bullish actions. On [..]

post-image

Stock markets nosedive on Jackson Hole fallout – Stock Market News

Posted on August 30, 2022 at 7:47 am GMT

Last Friday, the major US stock indices posted their worst day in months following Fed Chair Jerome Powell’s highly awaited speech at the Jackson Hole symposium, which clearly restated the Bank’s commitment to tame inflation and warned against premature loosening. This ultra-hawkish tone sent a crystal clear message to the markets that there is no ‘Fed pivot’ on the cards, propelling Treasury yields higher and inflicting severe damage on risky assets. So, what’s the outlook for equities going forward into [..]

post-image

Technical Analysis – US 500 plummets but 50-day SMA caps further decline

Posted on August 29, 2022 at 9:00 am GMT

The US 500 stock index (cash) has experienced a massive drop in the previous session, extending the retreat from its recent resistance point.  Even if the decline has come to a halt at the congested territory that includes the 50-day simple moving average (SMA) and the lower Bollinger band, the index retains its bearish near-term picture. The short-term indicators currently suggest that bearish forces have gained the upper hand. Specifically, the MACD histogram is approaching zero after crossing below its [..]

post-image

Technical Analysis – US 30 index regains strength ahead of Jackson Hole

Posted on August 26, 2022 at 12:57 pm GMT

The US 30 index (cash) has been edging higher since early June, generating a clear structure of higher highs and higher lows. Although the price experienced a downside correction after failing to cross above the 34,280, it has ticked up again in the last couple of daily sessions. The momentum indicators are endorsing a positive near-term bias. Specifically, the stochastic oscillator is ascending after posting a bullish cross in the oversold area, while the RSI is hovering above its 50-neutral mark. To [..]

post-image

Technical Analysis – Tesla stock moves sideways after rebound falters

Posted on August 24, 2022 at 12:05 pm GMT

Tesla’s stock has been in an uptrend since early June, generating a structure of higher highs and higher lows. However, in the past two weeks, the recovery seems to be stalling and the stock price is trading within a tight range around the 200-day simple moving average (SMA). The momentum indicators reflect this loss of positive momentum for the stock. Specifically, the stochastic oscillator has dropped near the 20-oversold zone, while the MACD histogram has dived beneath its red signal [..]

post-image

Technical Analysis – Amazon stock declines as 200-day SMA caps upside

Posted on August 23, 2022 at 2:06 pm GMT

Amazon’s stock has been in a recovery mode after finding its feet at the 26-month low of 99.70. However, the price has exhibited a downside correction since it failed to cross above its 200-day simple moving average (SMA). The momentum indicators are promoting the recent retracement as positive momentum seems to be waning. Specifically, the stochastic oscillator is pointing down inside the oversold territory, while the MACD histogram has crossed beneath its red signal line in the positive region. Should selling [..]

Risk Warning: Your capital is at risk. Leveraged products may not be suitable for everyone. Please consider our Risk Disclosure.