XM does not provide services to residents of the United States of America.

Stock Market News

post-image

 Technical Analysis – US 30 index hovers above the almost 2-year low

Posted on October 13, 2022 at 10:10 am GMT

The US 30 cash index has been moving sideways since the soft rebound on the 28,900 support, unable to fully recover losses made earlier this month. In the short-term, the market could maintain consolidation if the RSI keeps flattening below the 50 level, while the MACD is still in the negative region. An extension to the upside and above the 20-day simple moving average (SMA) at 29,750 could meet the area within the previous high of 30,470. Further up, resistance could [..]

post-image

Technical Analysis – US 30 index consolidates after 20-day SMA caps gains

Posted on October 12, 2022 at 2:30 pm GMT

US 30 stock index (cash) is consolidating after the latest upside attempt faltered when the price ran into the 20-day simple moving average (SMA). The momentum indicators are sending mixed signals, endorsing the current trendless motion. The RSI is flat below the 50-neutral level. On the other hand, both the %K and %D lines of the stochastic oscillator are sliding and could soon enter the oversold region. If the price manages to creep upwards in the next few sessions and [..]

post-image

Technical Analysis – JPMorgan’s stock plunges to 2-year low ahead of earnings

Posted on October 12, 2022 at 9:25 am GMT

JPMorgan’s stock has completely erased its remarkable 2021 uptrend, which peaked at a record high of 172.75 a year ago, despite the Fed’s rate hike cycle. The price plunged to 101.72 on Tuesday, reaching the lowest level since November 2020 ahead of the bank’s quarterly earnings results. From a technical perspective, the bearish wave in the four-hour chart has not bottomed out yet as the RSI continues to slide towards its 30 oversold level. Moreover, the stochastics are moving sideways below 20, [..]

post-image

US banks kick off a crucial earnings season as macro risks mount – Stock Market News

Posted on October 11, 2022 at 2:44 pm GMT

The biggest US banks will kickstart the third quarter earnings parade, with JP Morgan Chase, Morgan Stanley and Citigroup reporting their financial results on Friday before Wall Street’s opening bell. This earnings season will likely garner a lot of attention as it will assess companies’ resilience amid a continuously deteriorating macro environment, while major US banks’ performance often acts as a proxy for the health of the broader domestic economy. That being said, banks are expected to report a significant slump in profits despite the favourable [..]

post-image

Technical Analysis – US 500 index remains bearish as recent bounce runs out of steam

Posted on October 10, 2022 at 9:41 am GMT

The US 500 cash index is tumbling for the fourth red day after finding strong resistance at the 20-day simple moving average (SMA) near the 3,811 barrier. The RSI indicator is pointing down in the negative region, while the MACD is still in bearish area but is moving above its trigger line. If the index continues the negative movement, a lower low will be posted beneath the 3,630 trough. The price found strong support at the weekly SMA in the [..]

post-image

Technical Analysis – US 100 stock index hits a wall at 20-day MA as rebound stalls

Posted on October 6, 2022 at 2:49 pm GMT

US 100 stock index (cash) slumped to a two-year low of 10,836.34 on Monday before quickly turning higher. But the bounce back appears to be facing some difficulty after running into the 20-day moving average (MA) at 11,695. A tad higher lies the 50% Fibonacci retracement level of the uptrend from March 2020 to November 2021, adding even more weight to the resistance area of 11,700. The momentum indicators are flashing some warning signs about the sustainability of this upswing, [..]

post-image

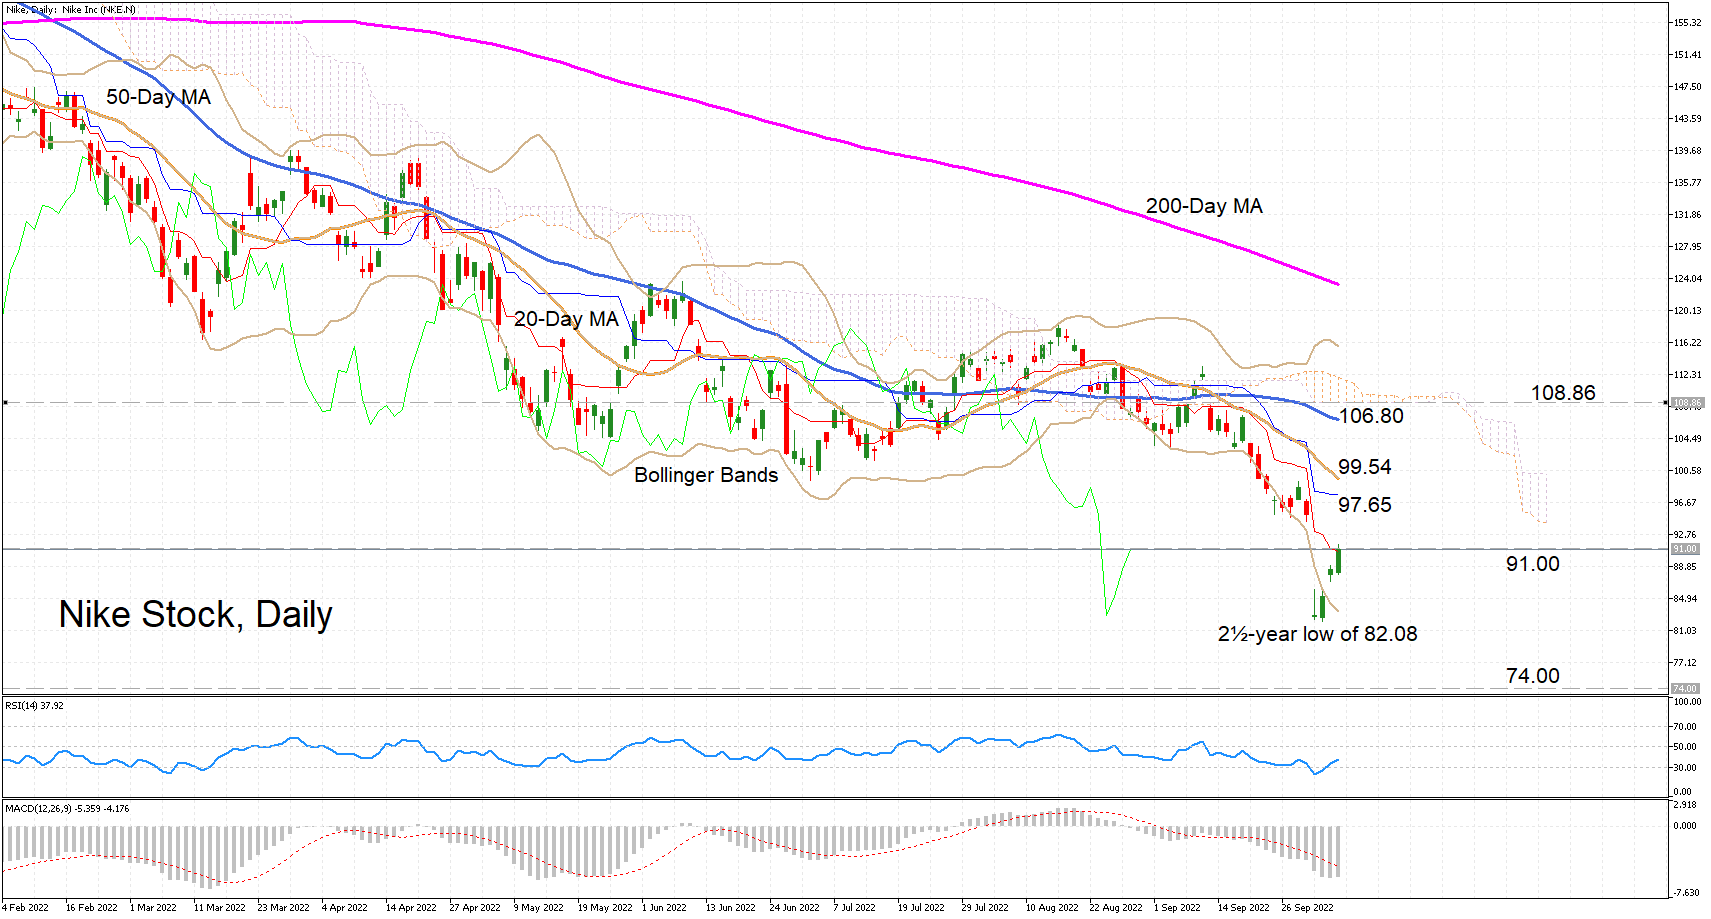
Technical Analysis – Nike stock bounces back from 2½-year low but outlook still bearish

Posted on October 6, 2022 at 1:04 pm GMT

Nike stock has staged an impressive rebound from the two-and-a-half year low of 82.08 plumbed on October 3 but it nevertheless remains deep in bearish territory. The RSI has climbed out of the oversold region, though it is some distance away from reaching the 50 neutral level. The MACD histogram appears to be bottoming out but is not yet near to crossing above the red signal line, which is still falling. Moreover, although the price has jumped back above the [..]

post-image

Technical Analysis – Twitter flies and hits 52.00

Posted on October 5, 2022 at 2:05 pm GMT

Twitter’s stock skyrocketed on Wednesday after Elon Musk expressed interest again in buying the social media firm for $54.20 a share. From a technical standpoint, the share price has been printing higher lows since July 7 and thus, even if it pulls back after the overstretched rally, the bulls may remain interested and recharge at some point soon. The RSI and the MACD detect strong upside speed and support the notion for further advances. The former lies above 70, while the [..]

post-image

Can US stock markets finish the year on a solid note? – Stock Market News

Posted on October 4, 2022 at 3:01 pm GMT

US equity indices rallied on the first trading day of the fourth quarter, rebounding strongly from their multi-month lows and notching their largest daily increases since early August. This advance comes after a significant retreat following the stronger than expected PCE inflation print on Friday, which concluded a devastating three-quarter losing streak for the indices. Even though signs of optimism are slowly emerging, the underlying risks that have tormented risky assets so far in the year are still in play. Devastating year, [..]

post-image

Technical Analysis – US 500 plummets to fresh 22-month low

Posted on October 3, 2022 at 8:48 am GMT

The US 500 stock index (cash) has been constantly losing ground in the short term, recording consecutive fresh multi-month lows. Moreover, the price has dived beneath both its 50- and 200-day simple moving averages (SMAs) alongside the lower boundary of the Ichimoku cloud, painting a rather gloomy technical picture. The short-term oscillators currently suggest that bearish forces are strengthening. Specifically, the MACD histogram is retreating further below both zero and its red signal line, while the RSI is declining within its 30-oversold zone. Should selling [..]

Risk Warning: Your capital is at risk. Leveraged products may not be suitable for everyone. Please consider our Risk Disclosure.