XM does not provide services to residents of the United States of America.

Stock Market News

post-image

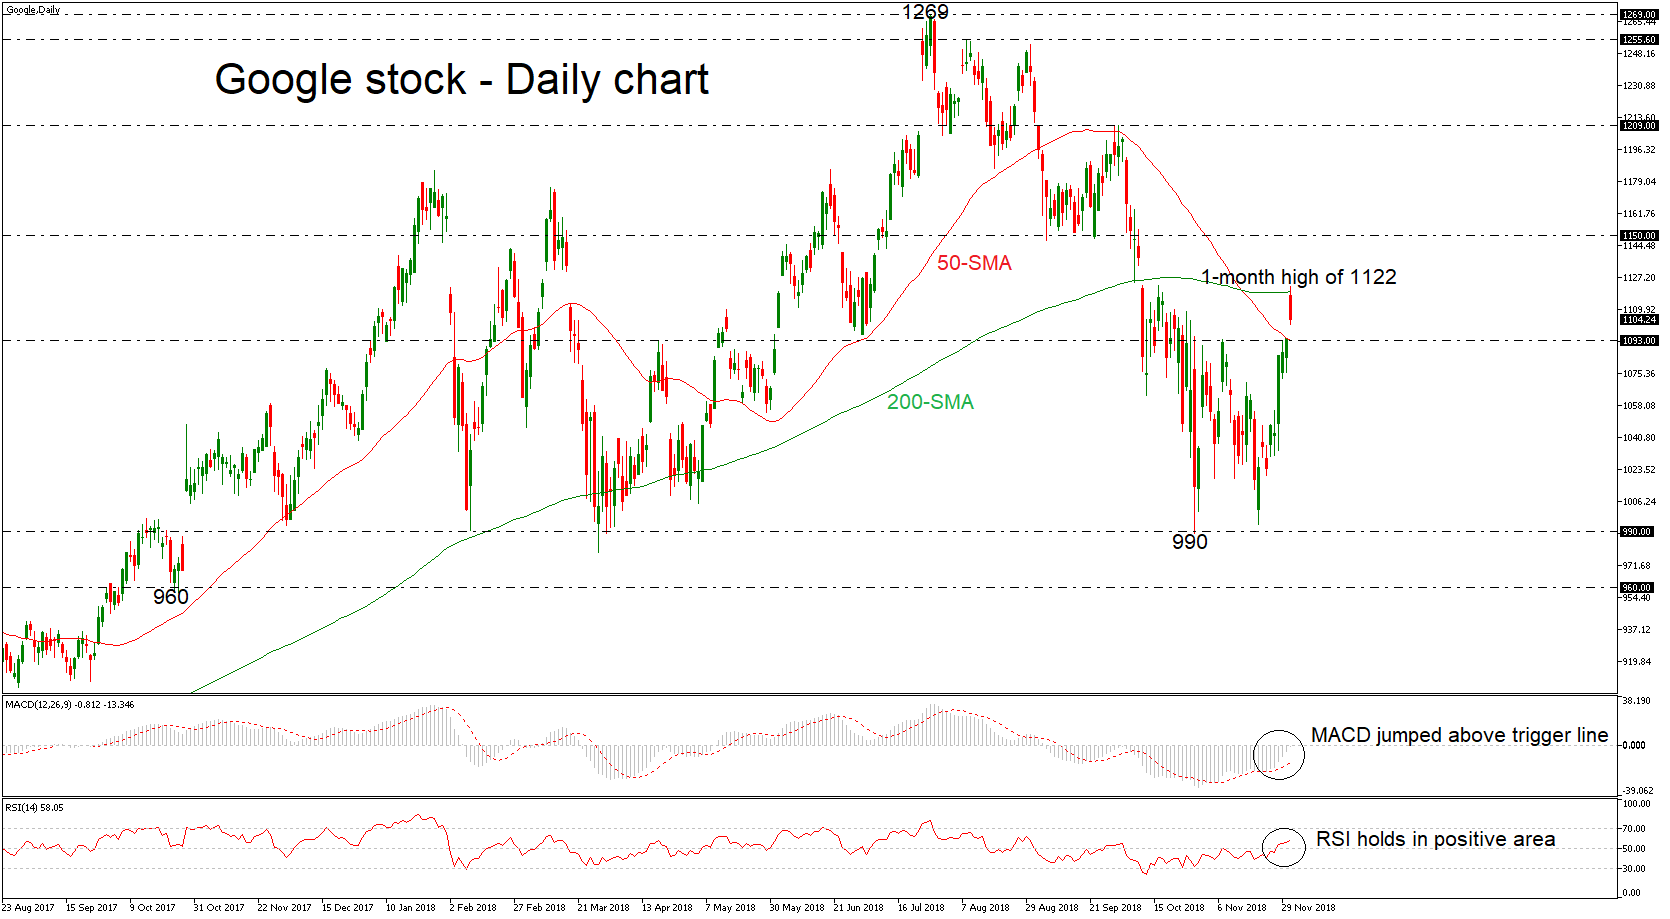
Technical Analysis – Google stock registers 1-month high finding resistance at 200-day SMA

Posted on December 4, 2018 at 1:24 pm GMT

Google (Alphabet) stock price has fallen sharply from the one-month high of 1122, reached earlier on Monday, after the bullish gap. However, the technical indicators are still endorsing the positive view. The MACD oscillator is strengthening its momentum above the trigger line but is below the zero line, while the RSI indicator is heading north above the threshold of 50. If the recent declines continue, immediate support is likely to come again from the 1093 barrier, which overlaps with the 50-day [..]

post-image

Technical Analysis – Amazon stock struggles below 200-day SMA in near term

Posted on November 30, 2018 at 11:18 am GMT

Amazon stock price rebounded after touching a seven-month low on November 20, however it still trades below the 200-day simple moving average (SMA). Having a look at the momentum indicators, they are giving mixed signals. On the one hand the MACD is reducing its negative momentum, while the stochastic is turning slightly lower in the overbought zone, signaling possible losses. Also, the RSI is flattening, marginally above the neutral threshold of 50. Advances may stall initially near the 200-day SMA, which stands around yesterday’s high of 1694. A clear climb above [..]

post-image

Technical Analysis – Facebook stock rebounds off two-year lows, but still negative

Posted on November 30, 2018 at 11:07 am GMT

Facebook’s stock saw a dramatic collapse after touching an all-time high of 218.44 in late July, falling below its 50- and 200-day simple moving averages (SMAs) to find support near the two-year low of 128.00 on November 20, and subsequently rebounded. With the price structure now consisting of lower peaks and lower troughs below the SMAs, the medium-term picture seems firmly negative. Short-term oscillators however, suggest the current rebound may continue in the immediate term. The RSI is detecting fading [..]

post-image

Technical Analysis – Nvidia stock stabilizes after sharp drop, but outlook negative

Posted on November 28, 2018 at 3:26 pm GMT

Nvidia’s stock dropped sharply after touching an all-time high of 292.65 in early October, falling below its 50- and 200-day simple moving averages (SMAs) to record a one-and-a-half year low of 138.00 on November 20. The price structure on the daily chart consists of lower highs and lower lows lately and thus, the medium-term outlook seems negative. Attesting to this, the 50-day SMA has recently crossed below the 200-day SMA. Short-term oscillators though, suggest a rebound may be in store. [..]

post-image

Technical Analysis – Twitter stock jumps slightly higher in bearish correction area

Posted on November 27, 2018 at 2:38 pm GMT

Twitter stock remains under selling pressure after the bounce off the 47.70 resistance level on June 15. However, over the previous sessions, the price climbed within the 20- and 40-simple moving averages (SMAs) in the daily timeframe and is currently trading above the 50.0% Fibonacci retracement level at 30.92 of the upleg from 14.10 to 47.70. In the short-term, technically, the RSI indicator is sloping slightly to the upside above the neutral threshold of 50, while the MACD oscillator stands below the trigger [..]

post-image

Technical Analysis – Apple stock records 6-month lows shifting outlook to negative

Posted on November 26, 2018 at 2:28 pm GMT

The Apple stock completed four consecutive red days below the uptrend line, which had been standing since February 9, achieving a new six-month low of 172.12. The technical indicators are endorsing the recent view with the RSI dropping in the oversold zone and the MACD is strengthening its negative momentum below the trigger line. Further downside pressures could drive the stock even lower towards the 160.50 support level, reached on April 27. Moving significantly lower, there is no major support level [..]

post-image

Stock Market News – More Apple pain by year-end?

Posted on November 22, 2018 at 3:27 pm GMT

Apple, the world’s largest company by market capitalization, has come under intense selling pressure from early October onwards, losing its trillion-dollar valuation. Growing worries over iPhone demand, the firm’s key profit-earner, acted as the catalyst for the fall. Moving forward, there are some developments that may justify more pain for the stock by year-end.   A slew of analyst reports pointing to a year-over-year drop in iPhone unit sales as soon as the first quarter of 2019 were instrumental for [..]

post-image

Technical Analysis – Netflix stock price rises following bounce off 9-month low

Posted on November 21, 2018 at 1:02 pm GMT

Netflix’s stock price registered a fresh nine-month low near 255.00 on Tuesday after the 50- and 200-simple moving averages posted a death cross in the aftermath of significant losses in the stock. Technically, the stock is looking bearish in the short term. Attesting to this, the RSI has been declining overall towards the oversold zone, while the MACD oscillator dropped below the trigger line and is strengthening its downward momentum in the daily timeframe. More declines could turn traders’ attention until the 235.00 support level, identified by [..]

post-image

Technical Analysis – Amazon stock recovers from seven-month lows, but still bearish

Posted on November 16, 2018 at 12:22 pm GMT

Amazon’s stock price rebounded after touching a seven-month low on October 30, but continues to trade below its 200-day simple moving average (SMA). Additionally, the price structure on the daily chart consists of lower highs and lower lows. Combined, these imply the outlook remains bearish in both the short- and medium-terms. Momentum oscillators are hovering in negative territory, enhancing the argument. The RSI is already below 50, but is sloping up, while the MACD seems ready to challenge its red [..]

post-image

Technical Analysis – Apple stock loses momentum and dips below uptrend line

Posted on November 15, 2018 at 2:27 pm GMT

The Apple stock price tumbled below the rising trend line, which has been standing since February 9, achieving a new four-month low of 185.83. The price has lost momentum aggressively over the last couple of days as it dropped below the 200-day simple moving average (SMA), while the technical indicators are endorsing the recent view. The RSI is approaching the oversold zone and the MACD is strengthening its negative momentum below the trigger line. Further declines could find immediate support at the [..]

Risk Warning: Your capital is at risk. Leveraged products may not be suitable for everyone. Please consider our Risk Disclosure.