XM does not provide services to residents of the United States of America.

Stock Market News

post-image

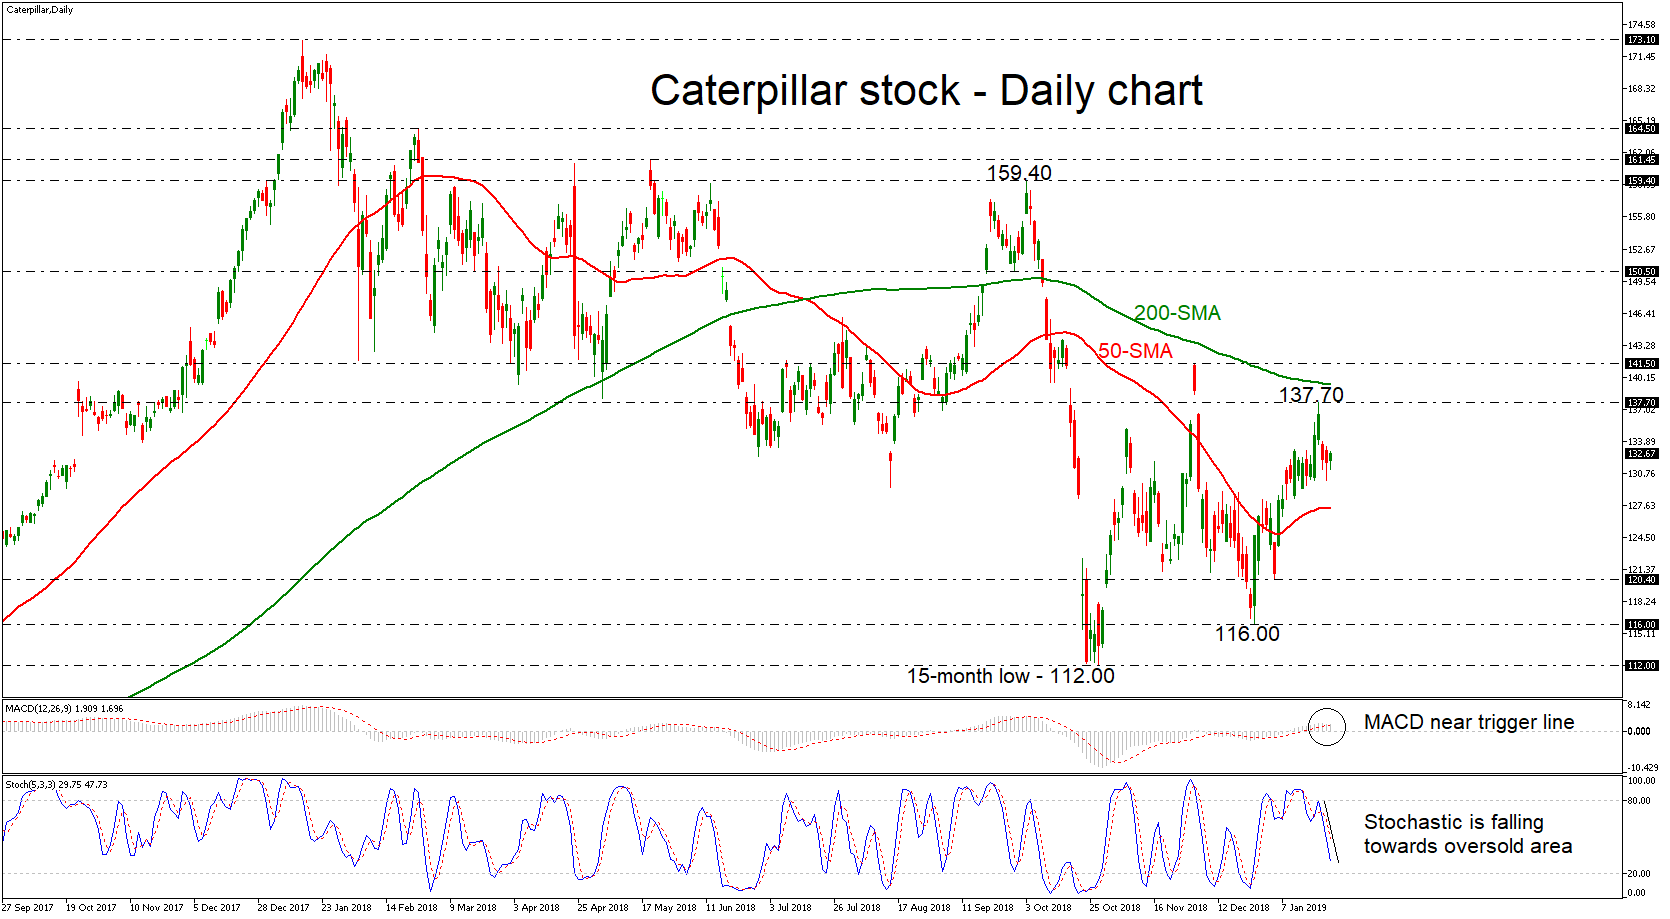
Stock Market News – Caterpillar’s earnings could drive market sentiment

Posted on January 25, 2019 at 1:32 pm GMT

Caterpillar – which is seen as a bellwether for global economic activity – will announce its quarterly results on Monday, two hours ahead of Wall Street’s opening bell. Against the backdrop of slowing global growth and trade tensions, the guidance by management for 2019 could prove equally, if not more important than the actual earnings figures for the market reaction. The world’s largest manufacturer of heavy equipment is projected to report earnings per share (EPS) of $2.99 in the closing [..]

post-image

Technical Analysis – Caterpillar stock builds base within SMAs; bearish in long term

Posted on January 25, 2019 at 11:57 am GMT

Caterpillar stock price came under pressure in the previous couple of sessions, falling back below its 137.70 resistance level. Looking at momentum oscillators on the daily chart though, they suggest further declines may be on the cards in the short-term. The stochastic oscillator is approaching the oversold area, detecting negative momentum, and is also pointing downwards. The MACD is ready for a bearish cross with its trigger line in the positive zone. Should the price decline, it could meet support at the 50-day simple moving average (SMA) around 127.40. Then [..]

post-image

Stock Market News – Intel’s earnings: upside surprise on the cards?

Posted on January 23, 2019 at 12:01 pm GMT

Intel will report its earnings for the latest quarter on Thursday, after the US market close. Given that demand has been rising so fast the company has been unable to meet all of it, risks seem tilted towards a beat in earnings and revenues, as opposed to a disappointment. That said, besides the earnings figures, the guidance by management for 2019 will also be critical for the stock’s reaction, and perhaps even for broader market sentiment. The California-based semiconductor giant [..]

post-image

Technical Analysis – UBS stock to remain under pressure after disappointing earnings results

Posted on January 22, 2019 at 11:46 am GMT

UBS Swiss Bank missed analysts’ earnings estimates on Tuesday, sending its stock price below the 200-period simple moving average (MA) on the four-hour chart and straight down to one-week lows. Technically the short-term bias looks neutral to negative according to momentum indicators; the RSI seems to be flattening below its 50-neutral threshold, while the MACD keeps weakening towards zero and below its red signal line. A leg lower could touch the 50-period MA currently at 12.71 where any violation could set [..]

post-image

Technical Analysis – IBM stock looks positive ahead of Q4 earnings results

Posted on January 21, 2019 at 3:52 pm GMT

IBM’s stock price unlocked fresh one-month highs on Friday ahead of the company’s quarterly earnings results on Tuesday. Technically, the market is expected to continue the rebound off the decade lows as the RSI fluctuates positively above its 50 neutral mark and the MACD keeps strengthening to the upside and above its red signal line. An extension higher could find a barrier between Friday’s high of 124.66 and the 126.51 peak on December 3, which if violated could result to further improvement, with the price [..]

post-image

Technical analysis – Tesla stock clears moving averages, cautiously positive in medium-term

Posted on January 18, 2019 at 1:07 pm GMT

Tesla’s stock crossed back above both its 50- and 200-day simple moving averages (SMAs) in recent sessions and is also trading above an uptrend line drawn from the lows of October. The combination suggests the outlook has turned cautiously positive. For the picture to turn decisively positive, it may require a higher high on the daily chart, namely a clear break above 379. Short-term momentum oscillators support the notion. The RSI is flattening slightly above its neutral level, while the [..]

post-image

Technical Analysis – Johnson & Johnson stock price struggles within tight Bollinger band; bullish in long term

Posted on January 18, 2019 at 11:06 am GMT

Johnson & Johnson stock price has been squeezed within the Bollinger bands over the last couple of weeks in the daily timeframe, failing to pare some of the losses that were posted in mid-December. From the technical point of view, the indicators seem to be flat. The RSI is standing below 50 level with weak momentum, while the ROC is moving sideways near the zero line in the short-term. Upside moves may drive the price action higher towards the immediate resistance of 130.45 before touching the [..]

post-image

Stock Market News – Netflix releases earnings: subscriber growth and pricing strategy in focus

Posted on January 16, 2019 at 2:52 pm GMT

Netflix will release its earnings report for Q4 on Thursday, after Wall Street’s closing bell. Beyond the actual earnings numbers, markets will also dissect the firm’s subscriber growth to gauge its future prospects. The management’s guidance on that subject, as well as their expectations around revenues following the latest hike in monthly subscription charges, will be crucial for the stock’s reaction too. The subscription-based streaming provider is anticipated to have made $0.24 in earnings per share (EPS) during the final [..]

post-image

Technical Analysis – Bank of America stock price could see further strength in near term

Posted on January 16, 2019 at 9:26 am GMT

Bank of America stock price has had one of the best trading sessions over the last three consecutive weeks, following the pullback on the 19-month trough of 22.62. The price touched the 26.75, a one-month high, and the upper Bollinger Band in Tuesday’s trading period. The technical indicators are still located in bullish area in the daily chart, with the RSI stretching further above its neutral threshold of 50 while the stochastic oscillator posted a bearish crossover within its %K and %D lines. Yet the latter could [..]

post-image

Technical Analysis – JPMorgan stock advances in near term; indicators signal bearish actions

Posted on January 15, 2019 at 9:07 am GMT

The JPMorgan stock price is continuing last month’s rebound on the 16-month low of 91.07, touching the 101.45 resistance level. However, looking at the technical indicators, they suggest bearish actions as the price opened with a gap down in the previous sessions. The stochastic oscillator is moving lower below the overbought level, while the ROC is pointing down above the zero line. The 38.2% Fibonacci retracement level of the downleg from 119.18 to 91.07, around 101.81 could be a trigger [..]

Risk Warning: Your capital is at risk. Leveraged products may not be suitable for everyone. Please consider our Risk Disclosure.