XM does not provide services to residents of the United States of America.

Stock Market News

post-image

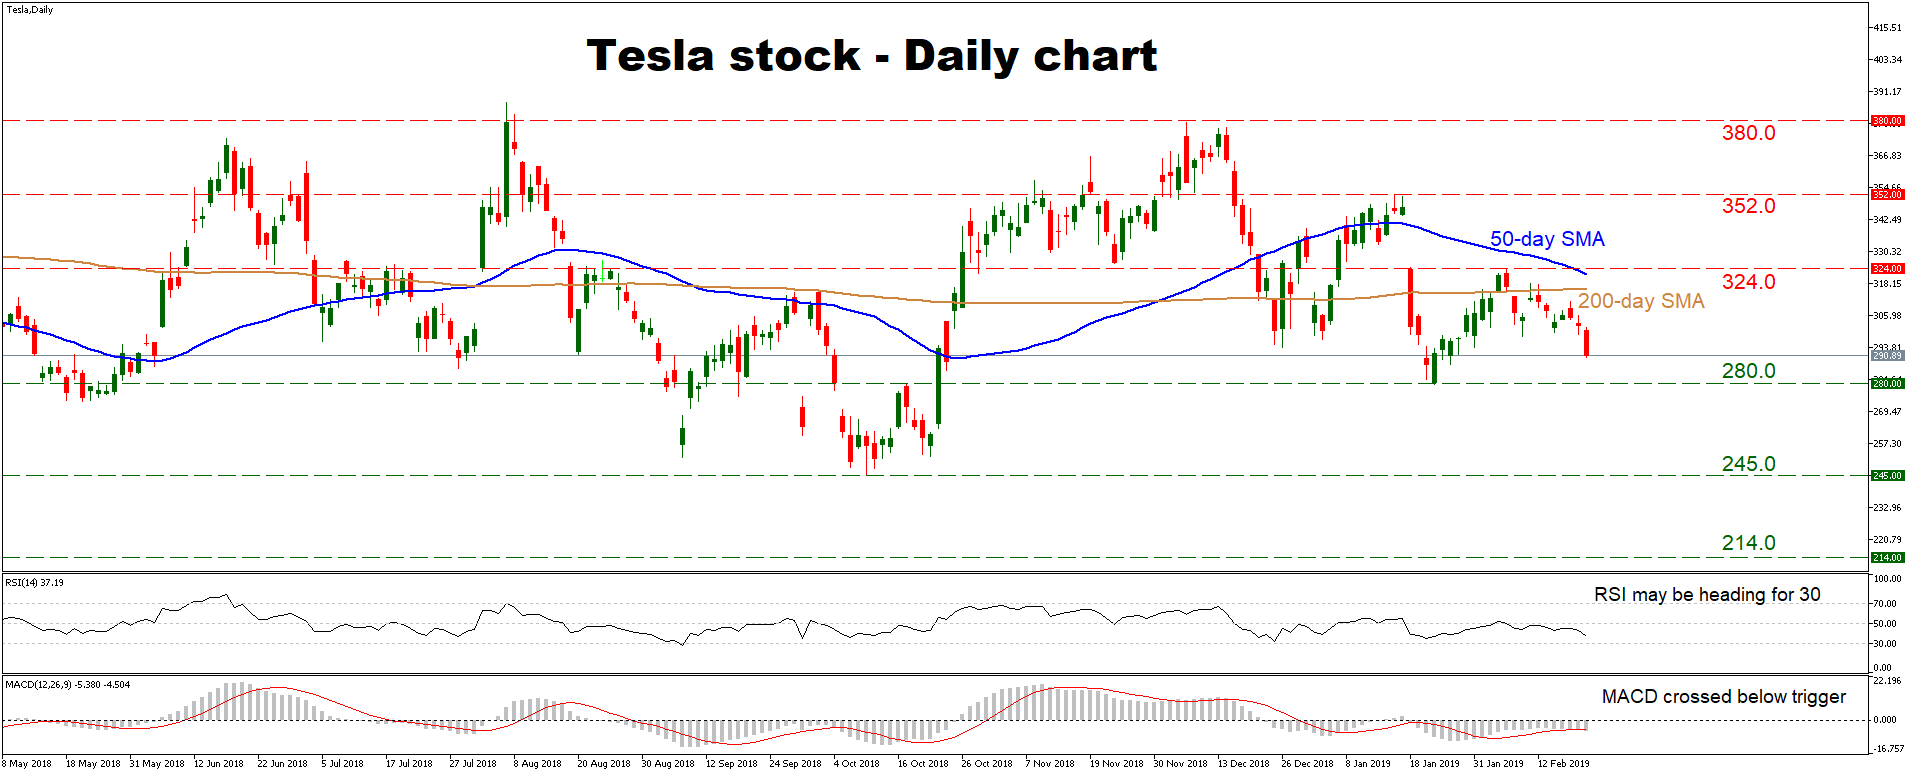
Technical Analysis – Tesla stock remains confined within a long-term range

Posted on February 22, 2019 at 2:05 pm GMT

Tesla’s stock has been trading within a wide sideways range – between 380.0 and 214.0 – since March 2017. The long-term outlook is therefore neutral, as is the short-term one, with the price oscillating between 324.0 and 280.0 for one month now. Looking at short-term momentum indicators, they paint a cautiously negative picture. The RSI seems headed for a test of its 30 zone, while the MACD has just crossed below its red trigger line. In case of another wave [..]

post-image

Technical Analysis – Apple stock surpasses 50-day SMA but stands within Ichimoku cloud

Posted on February 20, 2019 at 1:12 pm GMT

The Apple stock has rebounded on the multi-month low of 141.90 that was reached on January 3, surging above the strong 50-day simple moving average (SMA). The RSI and the MACD seem to be neutral with the former marginally sloping up above its 50 neutral mark and the latter flattening near the red trigger line. Also, the price stands inside the Ichimoku cloud and slightly below the red Tenkan-sen line in the daily timeframe. In case of a climb above the 175.00 resistance level and the 38.2% Fibonacci retracement [..]

post-image

Technical Analysis – Intel stock turns cautiously positive in short-term

Posted on February 15, 2019 at 1:01 pm GMT

Intel’s stock has been grinding higher in recent weeks and is now trading back above its 200-day simple moving average (SMA). Combined with the fact that price action since late October consists of higher lows, the short-term picture seems to have shifted to cautiously positive, from neutral previously. The notion is supported by short-term momentum oscillators as well, with the RSI being in positive territory and pointing up, and the MACD rising above its red trigger line. If the bulls [..]

post-image

Technical Analysis – PepsiCo stock hovers above MAs, modestly bullish in short-term

Posted on February 14, 2019 at 12:51 pm GMT

PepsiCo’s stock has been on an upward trajectory in recent months, recovering some of the losses it posted in late 2018. Recent price structure consists of higher lows, while the market is also trading above both its 50- and 200-day simple moving averages (SMAs), which keeps the medium-term outlook modestly positive. For the picture to shift to decisively positive, though, a new high above 121.80 is needed. Momentum oscillators paint a somewhat bullish picture as well, as the RSI is [..]

post-image

Technical Analysis – Coca Cola stock cautiously positive, eyes record highs

Posted on February 13, 2019 at 4:21 pm GMT

Coca Cola’s stock has been in recovery mode since late December, recently crossing back above its 50-day simple moving average (SMA). The medium-term picture currently seems cautiously positive, and for it to shift to clearly positive, it would require a decisive break above the all-time high of 50.74. Short-term oscillators support a somewhat positive outlook. The RSI is near its 70 zone, but seems to have flatlined, while the MACD remains firmly above its red trigger line. Further advances in [..]

post-image

Technical Analysis – Alcoa stock hovers below descending trend line with weak momentum

Posted on February 12, 2019 at 2:10 pm GMT

The Alcoa stock price dipped to a new two-year low of 24.98 on December 26 and it is currently hovering slightly above this level and below the 20-and 40-simple moving averages (SMAs) in the daily timeframe. The price remains below the medium-term descending trend line, which has been holding since April 19. However, technically, the RSI indicator keeps moving below the 50 level, while the %K line of the stochastic oscillator printed a bullish crossover with the %D line in the oversold zone, [..]

post-image

Technical analysis – Boeing stock breaks all-time high, uncharted waters ahead

Posted on February 6, 2019 at 2:32 pm GMT

Boeing’s stock touched a fresh all-time high of 410.5 on February 5, shifting the medium-term picture back to positive, from neutral earlier. The fact that price action is taking place firmly above both the 50- and 200-day simple moving averages (SMAs) amplifies this view. Looking at short-term momentum oscillators, both the RSI and MACD are painting a clearly positive picture. However, the fact that the RSI lies in overbought territory suggests some cause for caution in the immediate term. More [..]

post-image

Technical Analysis – Twitter stock surpasses 200-day SMA in sideways channel

Posted on February 6, 2019 at 2:04 pm GMT

Twitter stock has been trading within a sideways channel over the last six months with upper boundary the 37.10 resistance level and lower boundary the 26.20 support barrier. Currently, the price is trying to climb above the 200-day simple moving average, creating a bullish rally. From the technical point of view, the Relative Strength Index (RSI) is strengthening its momentum in the positive zone, approaching the 70 level, while the MACD oscillator is trying to surpass above the trigger line, [..]

post-image

Twitter reports earnings, all eyes on user growth – Stock Market News

Posted on February 6, 2019 at 11:14 am GMT

Twitter will report its quarterly earnings before the US market open on Thursday. The company has been striving to eradicate misinformation and ‘fake news’ from its platform, and so has seen its user growth wane, spelling troubles for its stock last year. Yet, the rebound in early 2019 suggests investors believe this may be a successful long-term strategy if it succeeds in mending Twitter’s brand credibility. The conference call with management, and how they view user growth going forward, will [..]

post-image

Technical Analysis – Google stock finds resistance around 200-day SMA; neutral in medium term

Posted on February 4, 2019 at 2:01 pm GMT

Google stock price has been finding a strong resistance level around the 200-day simple moving average (SMA) since Thursday, challenging the 50.0% Fibonacci retracement level of the downward movement from 1270 to 967, near 1119 as well. The upward spike sent prices towards a new three-month high of 1,124 and momentum indicators now suggest that the market sentiment might rise even higher as the stochastic lies in overbought area and the MACD surpassed the trigger line. Should bullish dynamics dominate, the market might revisit the 1,147 resistance in case of [..]

Risk Warning: Your capital is at risk. Leveraged products may not be suitable for everyone. Please consider our Risk Disclosure.