XM does not provide services to residents of the United States of America.

Stock Market News

post-image

Technical Analysis – Netflix stock finds support at 23.6% Fibonacci and 20-SMA

Posted on June 12, 2019 at 1:21 pm GMT

Netflix stock price posted a significant red day on Tuesday, heading below the short-term moving averages in the daily timeframe, creating a neutral bias. The RSI indicator dropped beneath the 50 level, while the MACD oscillator is weakening below the trigger line over the last month, but it is still developing in the negative territory. In case of more losses, support could come below the 23.6% Fibonacci retracement level of the upleg from 230.60 to 385.73, around 351 at the 322 barrier. A [..]

post-image

Technical Analysis – Facebook stock tumbles near 200-day SMA

Posted on June 4, 2019 at 12:22 pm GMT

Facebook stock price extended its losses over the previous couple of days, finding strong support at the 200-day simple moving average (SMA), marginally above the 38.2% Fibonacci of the wave 218.44 – 123.30 around 160.00. The RSI turned lower after entering oversold territory below 30. At the moment, it continues to head down in support of a negative short-term picture. The bias in the very-short-term also looks bearish as indicated by the MACD which is strengthening its negative momentum below [..]

post-image

Technical Analysis – Microsoft stock slips in narrow range in near term

Posted on May 29, 2019 at 11:30 am GMT

Microsoft price moved lower over the last few sessions, after it hit a new a multi-month high around 130.64, remaining in a short-term narrow range of 122.94 – 130.64. Looking at the momentum indicators, the RSI is flattening around the 50 level, while the stochastic is trying to turn higher in the daily timeframe. A move to the downside could find support at the lower boundary of the range of 122.94, which stands around the 40-simple moving average (SMA). A [..]

post-image

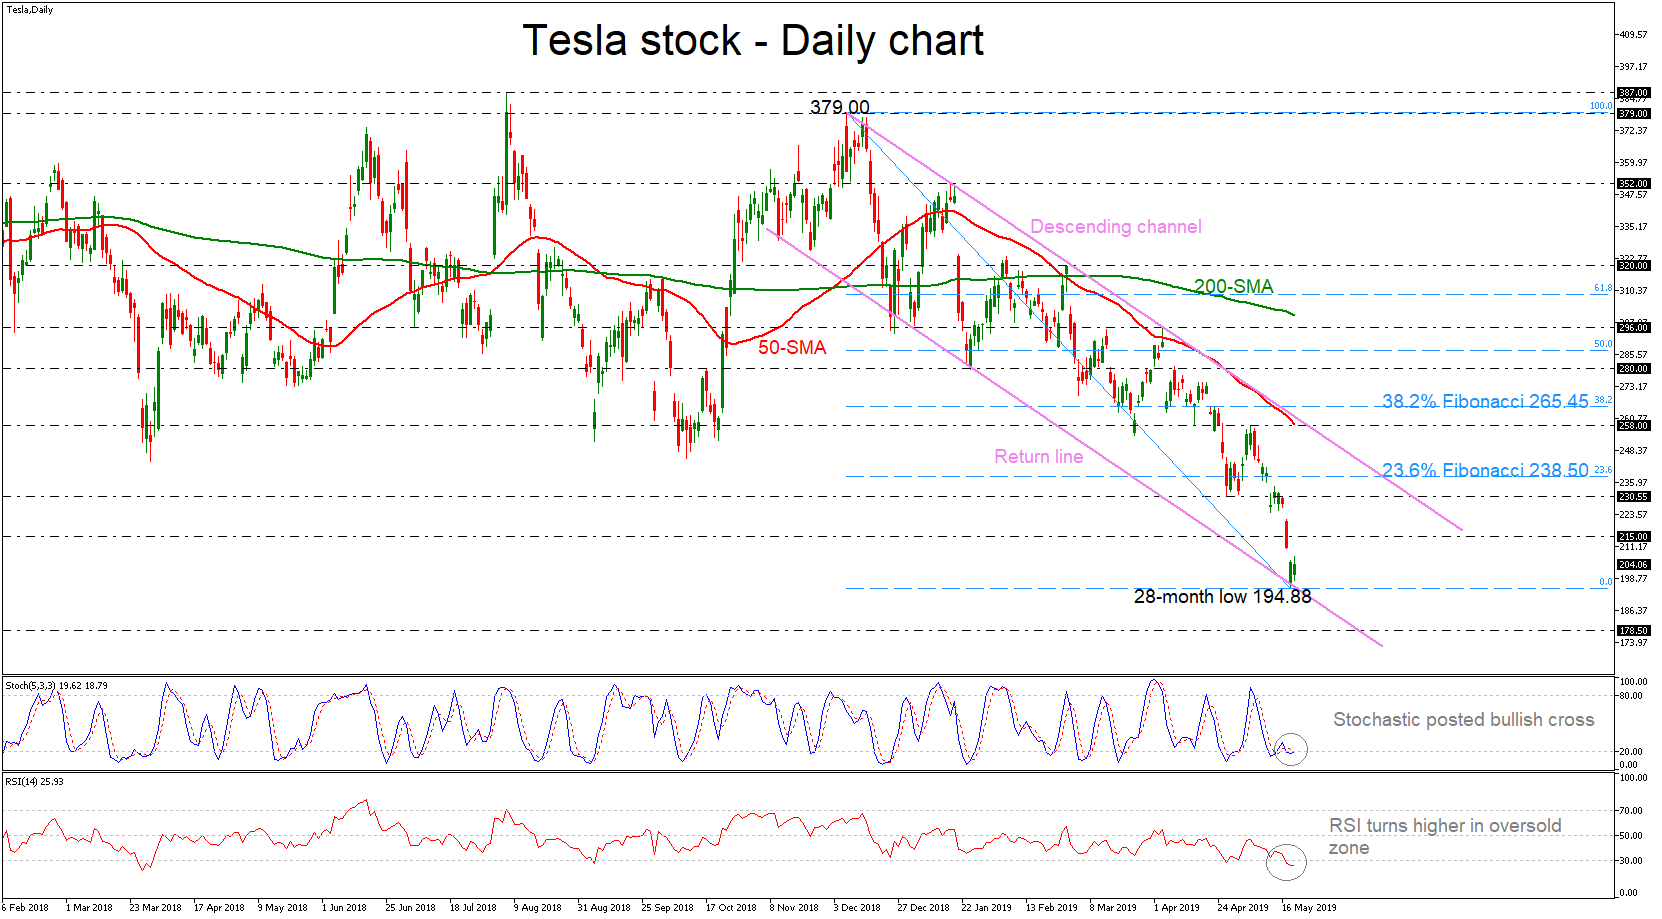
Technical Analysis – Tesla stock rebounds on descending channel after touching 28-month low 

Posted on May 22, 2019 at 11:48 am GMT

Tesla’s stock price has been developing within a descending channel over the last five months and during the previous period it challenged the return line once again. Also, the stock recorded a fresh 28-month low of 197.88. Looking at the short-term momentum indicators, they paint a cautiously positive picture. The RSI seems headed for a test of its 30 zone as it is turning higher, while the stochastic oscillator posted a bullish cross within the %K and %D lines in the oversold zone, suggesting [..]

post-image

Technical Analysis – Apple stock falls to 6-week lows after breaking bullish channel

Posted on May 15, 2019 at 2:43 pm GMT

Apple stock plunged to a six-week low of 184.60 after breaking the almost five-month old bullish channel to the downside. The risk remains negative in the four-hour chart as the price has also dropped well below the Ichimoku cloud, while the bearish crossover between the 20- and the 50-period simple moving averages (SMA) suggests the pair will continue to trend down. In momentum indicators, the MACD is discouraging as well, deepening in negative zone and under its red signal line. Yet [..]

post-image

Technical Analysis – Tesla stock hovers in downward sloping channel above 23-month low

Posted on May 10, 2019 at 11:03 am GMT

Tesla’s stock price has been trading within a downward sloping channel over the last five months. Looking at the short-term momentum indicators, they paint a cautiously negative picture. The RSI seems headed for a test of its 30 zone, while the stochastic is heading south in the daily timeframe. The ‘death cross’ within the 50- and 200-day simple moving averages (SMAs) is still holding, suggesting more losses. In case of another wave of declines in the market, sellers could encounter [..]

post-image

Specter of trade war returns to haunt markets – Special Report

Posted on May 9, 2019 at 2:39 pm GMT

Investor attention has turned back to trade, as the US considers whether to launch another round of tariffs on China early on Friday (04:00 GMT). If tariffs are indeed increased, that would probably send stock markets plunging as investors brace for China’s retaliation, or worse yet for a breakdown in the talks. In the bigger picture though, the most likely endgame is still that a deal will ultimately be reached. After months of optimistic comments from both the US and [..]

post-image

Technical Analysis – McDonalds stock retreats after posting multi-month high near 200.00

Posted on May 2, 2019 at 11:42 am GMT

McDonalds’ stock price has been making higher highs and higher lows since August 2018, creating an upward tilting channel. In the short-term, prices moved lower after the pullback on the multi-month high of 200.00 on April 30. The technical indicators are sending bearish signals, suggesting softness in the market in the near term. The RSI has found strong resistance in the overbought level and slipped below 70, indicating that the market could weaken a little bit in the short-term until the [..]

post-image

Technical Analysis – Apple stock pulls back from five-month high; holds uptrend alive

Posted on April 30, 2019 at 12:45 pm GMT

Apple’s stock price gave up some gains after topping at a fresh five-month high of 208.39 last week and as the RSI in the four-hour chart peaked in overbought area. The 20-period simple moving average (SMA), however, stood on the defensive once again, keeping the market action in the January uptrend. The falling RSI and the weakness in the MACD suggest that the price may find it hard to recover in the short term, turning the spotlight to the 20-period SMA (203.79) which if significantly [..]

post-image

Technical Analysis – Amazon stock drops after reaching 6-month high

Posted on April 25, 2019 at 10:43 am GMT

Amazon has been creating higher highs and higher lows after the rebound on the 1305 support level, jumping to a fresh six-month high of 1928 on April 23. Chances for a downside reversal, however, are increasing as the RSI indicator dropped below the overbought territory and the stochastic oscillator posted a bearish crossover within the %K and %D lines. Another step lower may reach a key support at the 20-simple moving average (SMA) currently at 1867, marginally above the 1852 [..]

Risk Warning: Your capital is at risk. Leveraged products may not be suitable for everyone. Please consider our Risk Disclosure.