XM does not provide services to residents of the United States of America.

Stock Market News

post-image

Technical Analysis – Goldman Sachs stock violates range area to the upside

Posted on July 15, 2019 at 2:18 pm GMT

Goldman Sachs stock had been consolidating since January but in the previous week, the price successfully surpassed the 210 resistance and the 50.0% Fibonacci retracement level of the downleg from 275 to 151.50 near 213.23, violating the range area to the upside. The sideway move held within 180.60 and 210 levels. The MACD is picking up speed in positive territory, suggesting a bullish bias for the short term. However, in the very short-term, downside corrections cannot be ruled out as the RSI is currently increasing positive [..]

post-image

Technical Analysis – Google stock finds support at 40-day SMA; breaks above 38.2% Fibo

Posted on July 11, 2019 at 1:12 pm GMT

Google stock price is creating a short-term upside rally over the last month, after the rebound on the five-month low of 1024. The price tested and broke the 38.2% Fibonacci of the down move from the all-time high of 1288.47 to low 1024, of 1124.50. A pullback in the up move found support on the culminating simple moving averages (SMAs) of 14-, 21- and 40-days on July 9. The short-term 14- and 21-SMAs confirm a positive momentum, as well as [..]

post-image

Technical Analysis – Netflix stock tests 7-month high; narrow range in medium term

Posted on July 11, 2019 at 9:44 am GMT

Netflix stock experienced a short-term upside rally from the bottom boundary of the trading range for the last month, that began at the end of April, to the upper boundary of a seven-month high of 386. The stock has temporarily faltered near the resistance, waiting for the buyers’ and sellers to set the direction.  Although in a sideways move, the short- and medium-term simple moving averages (SMAs) of 14-, 21- and 40-day SMAs, confirm a positive momentum on price action [..]

post-image

Technical Analysis – Amazon accelerates bullish rally to test all-time highs

Posted on July 10, 2019 at 2:45 pm GMT

Amazon stock has been experiencing a one-month bullish rally from a pullback move at the beginning of May to a low of 1670, and today broke aggressively above the seven-month high of 1964. With the help of short- and medium-term simple moving averages (SMAs) of 14 -, 21- and 40-day SMAs respectively, bullish crosses are in place confirming the momentum and positive trend which is in progress towards the highs. The MACD and the RSI are also supporting the bullish [..]

post-image

Technical Analysis – Google stock unable to break above 38.2% Fibo and 200-SMA

Posted on July 4, 2019 at 1:35 pm GMT

Google stock price has found a strong resistance level around the 38.2% Fibonacci retracement level of the downleg from 1,288.47 to 1,023.50 near 1,125 as it tries to extend its gains after the rebound on 1,023.50. Momentum indicators now suggest that the market sentiment might increase even higher as the stochastic lies in overbought area and the MACD is rising above its trigger line. If the market turns to the upside again and surpasses the 50-simple moving average (SMA) it could revisit the 1,147 resistance level before touching the 50.0% Fibonacci of [..]

post-image

Technical Analysis – Facebook stock stops near 9-month high; positive risks not faded yet

Posted on July 2, 2019 at 1:39 pm GMT

Facebook stock price advanced to a fresh one-month high of 195.00 yesterday before ending the day in the red. Momentum indicators signal are neutral to bullish with the RSI flattening in the positive territory and the MACD stretching to the upside above trigger and zero lines. However, the red Tenkan-sen line, which is above the blue kijun-sen line, looks to be heading north. Also, the price successfully overcame the Ichimoku cloud, suggesting that more gains would follow. An advance could stop at the nine-month high of 197.18 while [..]

post-image

Technical Analysis – Intel stock retreats after hitting 50-day SMA

Posted on June 28, 2019 at 11:47 am GMT

Intel’s stock is moving lower after finding significant resistance at the 50-day simple moving average (SMA). However, price action since late May consists of higher lows, the short-term picture seems to have shifted to cautiously positive. Thursday’s downward tendency is supported by short-term momentum oscillators as well, with the RSI being in positive territory and pointing down, while the MACD holds above its red trigger and zero lines with weak momentum. If the bears stay in control, immediate support to declines [..]

post-image

Technical Analysis – Apple recovers some ground, but remains neutral

Posted on June 26, 2019 at 1:38 pm GMT

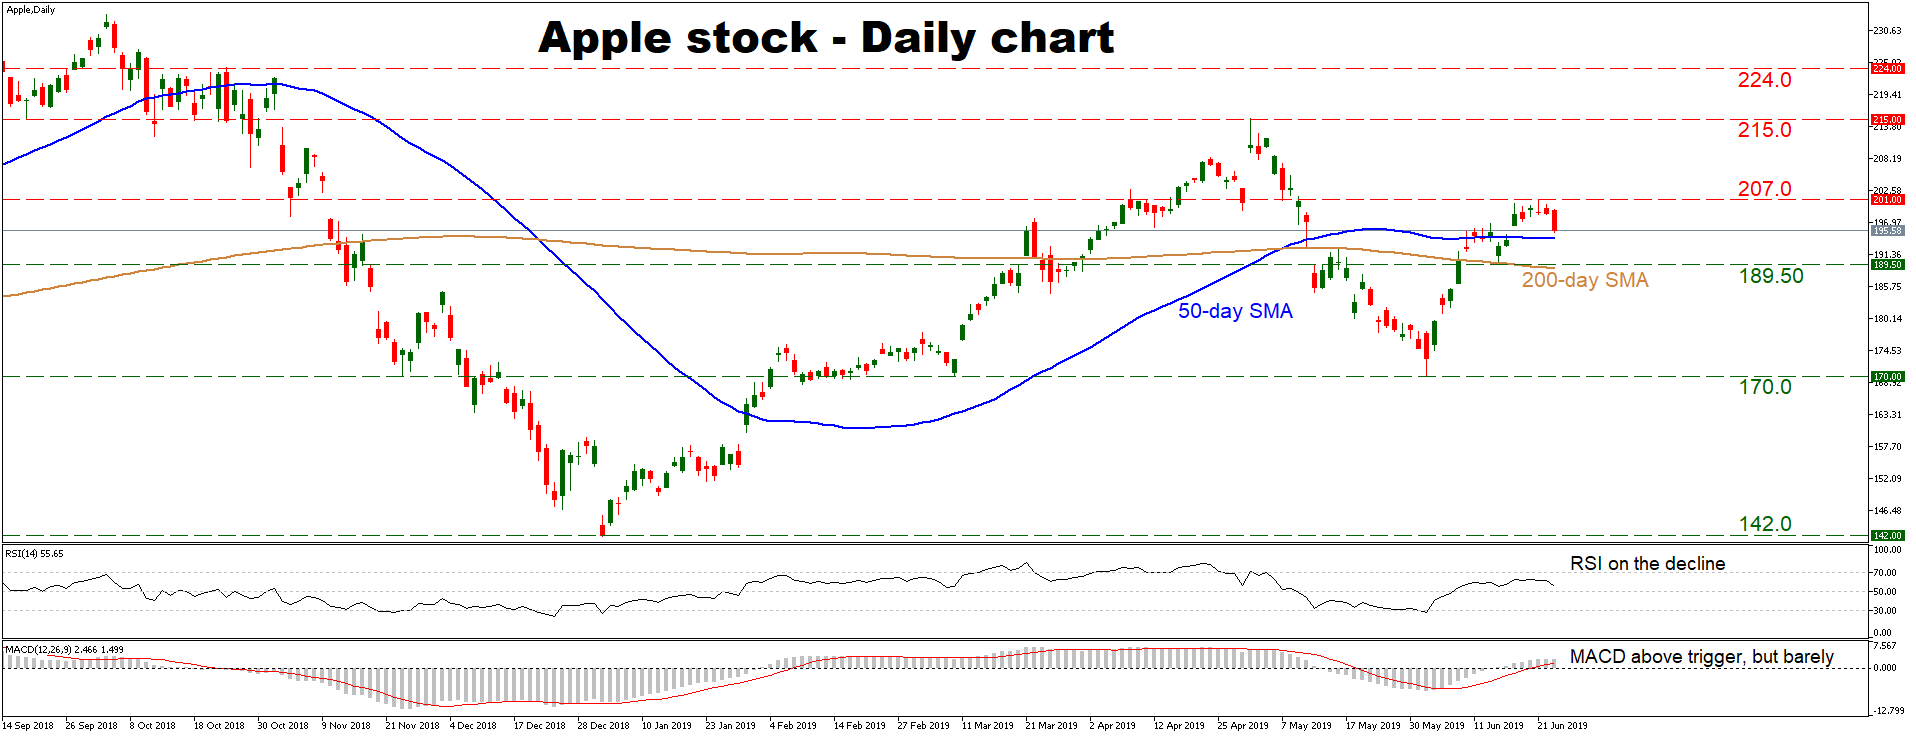
Apple’s stock has recovered somewhat in the past weeks but has failed to record a higher high on the daily chart, which keeps the medium-term picture neutral for now. A break above 215.0 would turn the outlook to cautiously positive, while a move below 170.0 would shift it to tentatively negative. Short-term momentum oscillators aren’t sending any clear signals either, with the RSI pointing down but being near its neutral level, while the MACD is hovering just above its red [..]

post-image

Technical Analysis – Tesla stock rebounds, but remains in a downtrend

Posted on June 26, 2019 at 12:00 pm GMT

Tesla’s stock rebounded in early June after touching a 2½-year low of 175.0, but the market remains below a longer-term downtrend line drawn from the highs of December 2018, keeping the broader outlook negative. The lower highs and lower lows on the daily chart, combined with price action taking place under the 50- and 200-day simple moving averages (SMAs), reinforce this view. Momentum indicators paint a neutral short-term picture, with the RSI barely above 50, and the MACD flirting with [..]

post-image

Technical Analysis – McDonald’s stock extends series of record highs

Posted on June 13, 2019 at 10:02 am GMT

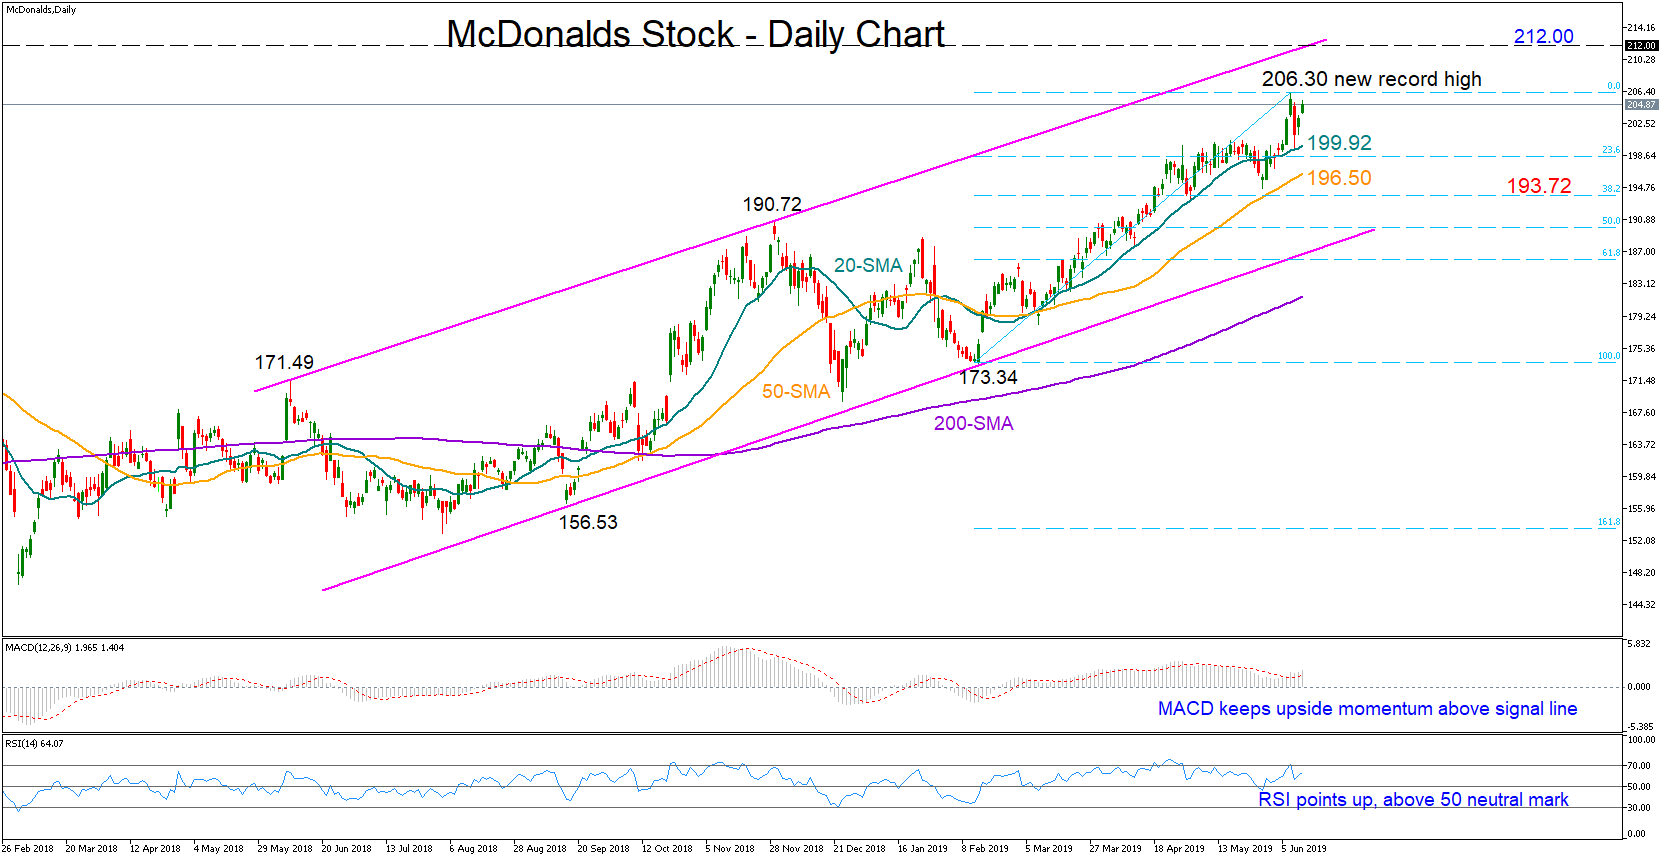
The burger chain saw its stock hitting a new record high of 206.30 on Friday, marking a growth of 17% for the year. The 20-day simple moving average (SMA) helped the bulls to retake control this week, while the positive momentum in the MACD and the RSI suggests the bullish party is not over yet for the stock. The peak at 206.30 could potentially work as nearby resistance should the price continue the rebound. Nevertheless, it would be more fascinating to see a rally towards the upper boundary of the long ascending [..]

Risk Warning: Your capital is at risk. Leveraged products may not be suitable for everyone. Please consider our Risk Disclosure.