XM does not provide services to residents of the United States of America.

Indices

post-image

Technical Analysis – JP 225 index defends bulls, but not out of the woods yet

Posted on August 11, 2022 at 10:17 am GMT

Japan’s 225 stock index (cash) stepped on the resistance trendline and the 20-day simple moving average (SMA) around 27,800 to defend its latest bullish break out of the bearish channel on Wednesday, but negative risks have not completely faded out. While the bullish intersection between the 20- and 200-day SMAs is promoting further trend improvement, the momentum indicators have been oscillating against the market action recently, with the RSI and the stochastics making lower lows and lower highs and the MACD losing [..]

post-image

Technical Analysis – US 100 index flatlines between key boundaries

Posted on August 9, 2022 at 9:02 am GMT

The US 100 stock index (cash) added more credence to its ongoing bullish wave after setting a strong foothold around June’s ceiling of 12,896 at the end of July, where the 38.2% Fibonacci retracement of the 6,634 – 16,767 upleg and a broken resistance line are also positioned. Some discomfort, however, seems to be growing as the index is flatlining just after touching the tentative descending trendline from December. The RSI and the Stochastics have recently pivoted southwards near their overbought [..]

post-image

Technical Analysis – US 500 index defends bullish direction; bias cautiously positive

Posted on August 8, 2022 at 9:02 am GMT

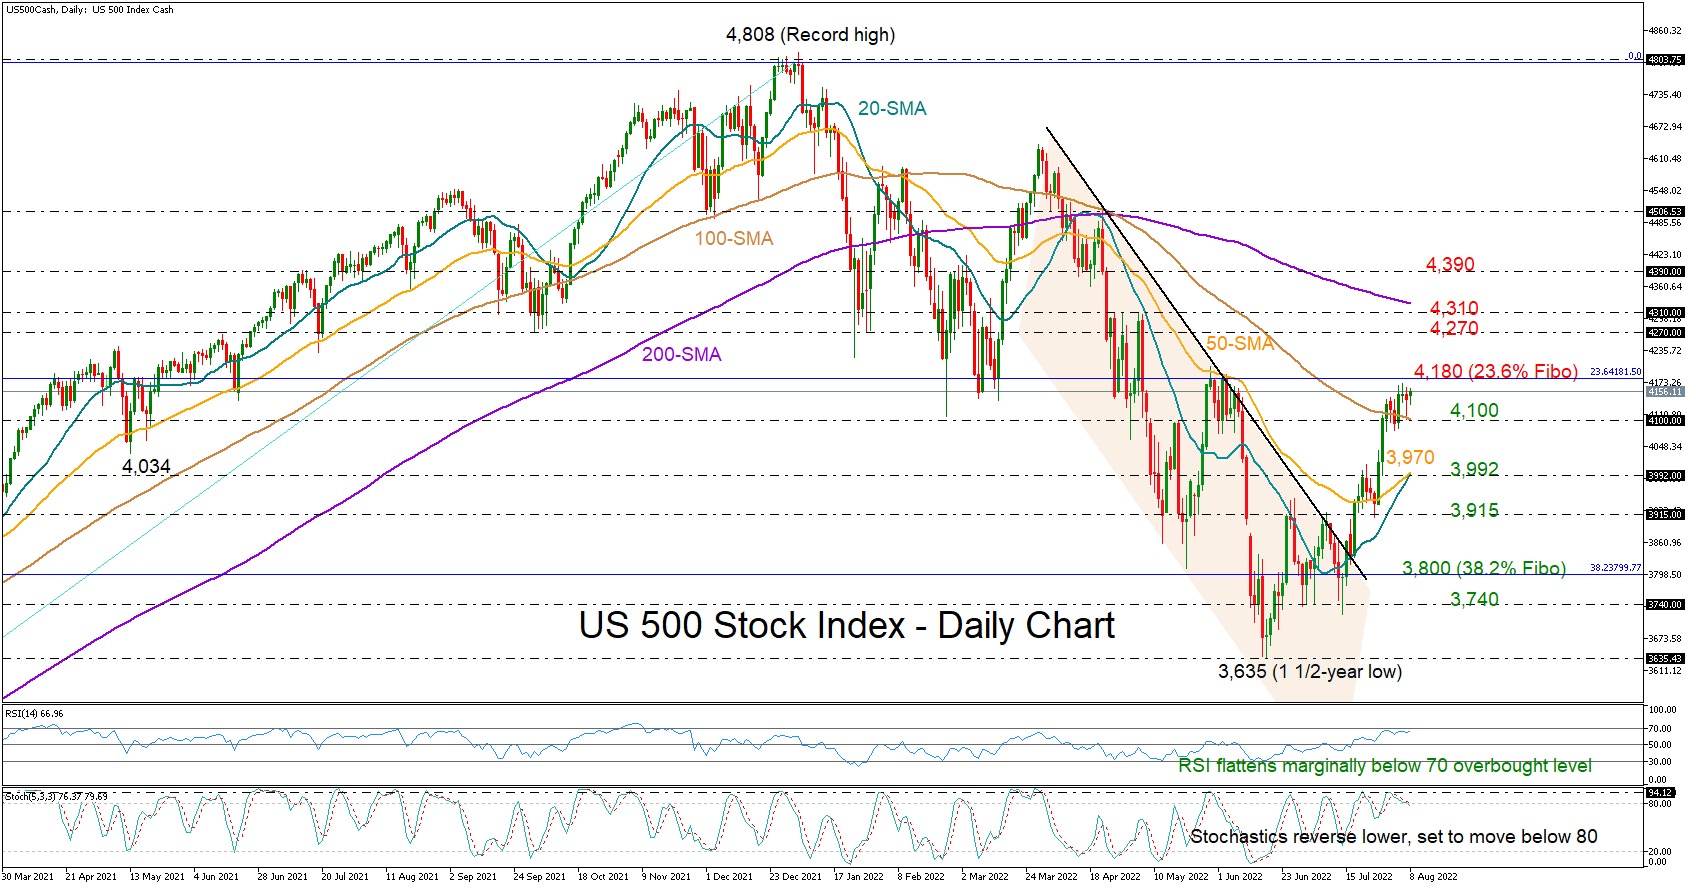
The US 500 stock index (cash) managed to crawl above its 100-day simple moving average (SMA) last week and rise as high as 4,170, adding more credence to the short-term bullish trend. Although the price is marginally below the previous high, a successful break of which is needed to violate the medium-term downtrend, the momentum indicators have started to flash overbought signals. The RSI is flattening marginally below 70, while the stochastics have already reversed south and are set to cross below [..]

post-image

Technical Analysis – US 500 index enters bullish territory

Posted on July 22, 2022 at 11:16 am GMT

The US 500 stock index (cash) advanced above its 50-day simple moving average (SMA) for the first time in three months to mark a new higher high at 4,000 on Thursday. The latest bullish action, which flourished after the price set a strong foothold around the penetrated bearish channel and the 20-day SMA earlier this week, has brightened prospects for future recovery. The technical oscillators are in line with this view, as the MACD is stretching its ascend within the positive [..]

post-image

Technical Analysis – US 30 index eyes July’s low as bears gain power

Posted on July 14, 2022 at 9:49 am GMT

The US 30 index (cash) has been in the red since the pullback from the steep descending trendline around 31,500 almost a week ago, currently approaching July’s trough of 30,349. The technical picture remains ugly. The index has slipped back below its 20-day simple moving average (SMA). At the same time, the RSI has resumed its negative momentum after failing to climb above its 50 neutral mark, while the MACD and the Stochastics are following lower as well, all foreseeing more gloomy sessions [..]

post-image

Technical Analysis – US 500 index awaits fresh impetus between key boundaries

Posted on July 12, 2022 at 3:23 pm GMT

The US 500 stock index (cash) pivoted southwards after receiving another rejection near the familiar descending trendline at $3,916 last Friday, which has been navigating the market southwards since the end of April. Encouragingly, the support area around the 38.2% Fibonacci retracement of the 2020 rally is still valid at $3,813, feeding some hopes that the latest bullish wave may last longer than the previous ones. The continuous improvement in the MACD is also reflecting a buildup in buying appetite. Yet, the RSI [..]

post-image

Technical Analysis – JP 225 index maintains cloudy outlook

Posted on June 22, 2022 at 9:22 am GMT

Japan’s 225 stock index (cash) got rejected near the 50% Fibonacci retracement of the 24,500 – 28,649 upleg at 26,576 soon after departing from May’s base of 25,508. The bearish bias is still in play as the RSI is retracing its latest rebound below its 50 neutral mark, while the MACD keeps extending its negative momentum below its red signal line. If the 61.8% Fibonacci of 25,820 gives way on the downside, the bears will push harder to escape the trap around 25,508 and [..]

post-image

Technical Analysis – GER 40 index posts 5-week high after rebound off 13,270

Posted on May 30, 2022 at 12:00 pm GMT

The German 40 cash index is continuing last week’s rebound but with slower momentum, reaching a five-week high near 14,600. The short-term bias looks positive as the MACD keeps gaining ground above its trigger line, while the RSI seems to be making its way up above its 50-neutral mark, though more progress is needed from the latter. The 15,000 could be a trigger point for steeper bullish action if the index manages to break the 14,600 line. Even higher, the 200-day [..]

post-image

Technical Analysis – US 500 index surges within short-term SMAs; bullish bias

Posted on May 30, 2022 at 7:07 am GMT

The US 500 cash index has advanced considerably over the last couple of days, reaching the 40-day simple moving average (SMA). The failed attempt by the price to drop below the 3,810-3,860 support zone, drove the technical indicators higher as well. The RSI is rising above the neutral threshold of 50, while the MACD is moving above its trigger line and below its zero level. Should the pair manage to strengthen its positive momentum, the next resistance could come around 4,210, which overlaps with the 40-day SMA. [..]

post-image

Technical Analysis – US 500 index’s downside bearing curbed as buyers step in

Posted on May 23, 2022 at 2:24 pm GMT

The US 500 stock index (Cash) is trading near the red Tenkan-sen line at 3,952 following an increase in risk appetite around a recorded 14½-month low of 3,809. The rolling over of the 200-day simple moving average (SMA) is feeding a dampening picture in the index, while the bearish 50- and 100-day SMAs are endorsing the decline from the end of March. The Ichimoku lines are signalling a pause in negative forces, while the short-term oscillators are reflecting the fading [..]

Risk Warning: Your capital is at risk. Leveraged products may not be suitable for everyone. Please consider our Risk Disclosure.