XM does not provide services to residents of the United States of America.

Indices

post-image

Technical Analysis – CHI50 stock index set for the biggest daily jump of the year; neutral in short term

Posted on October 19, 2018 at 8:53 am GMT

CHI50 stock index is currently building its biggest green candle of the year in the four-hour chart and in the daily timeframe as well, reversing losses which led the price to a one-month low of 10,689 on Thursday. The technical picture though supports that the price might lack direction in the short term as the RSI approaches its 50 neutral threshold and the MACD flirts with its red signal line. However, if bullish pressures dominate, the index could run up to test the latest peak at [..]

post-image

Technical Analysis – US 100 retains within ascending channel in long term

Posted on October 18, 2018 at 1:35 pm GMT

The US 100 index continues to move within the rising titled channel over the past nine months, stretching its upward pattern to a fresh record high. Looking at the very short-term, the price rebounded on the 6885 support in the previous week, climbing above the 200-day simple moving average (SMA). According to the MACD, the positive momentum could push for further gains in the short-term as the indicator picks up steam below the zero line. The stochastic oscillator is also advancing, though, it [..]

post-image

Technical Analysis – Euro Stoxx 50 index remains below moving averages despite upside correction

Posted on October 17, 2018 at 12:38 pm GMT

The Euro Stoxx 50 (EU50) index hit a 22-month low of 3167.70 on October 12, falling further below its moving averages (MA), before reversing higher. However, the rebound was cut short today after the index met resistance at the 38.2% Fibonacci retracement level of the downleg from 3453.70 to 3167.70. The easing of the positive momentum is supported by the RSI, which appears to be flatlining before even reaching the 50-neutral level. However, the stochastics suggest there is more upside [..]

post-image

Technical Analysis – UK100 stock index struggles near 6 ½-month lows; risk skewed to the downside

Posted on October 15, 2018 at 8:31 am GMT

UK100 stock index (FTSE 100) has been under severe pressure over the past two weeks, tumbling to a 6 ½-month low of 6920.60 last Thursday. While the MACD and the RSI have somewhat improved in the four-hour chart, with the former gaining strength above its red signal line and the latter inching above its 30 oversold threshold, chances for downside corrections remain high as both indicators continue to hold well into the bearish territory; the MACD far below zero and [..]

post-image

Technical Analysis – US 30 index bulls retake control after sharp sell-off

Posted on October 12, 2018 at 11:21 am GMT

The US 30 index has plummeted considerably over the last couple of days, recording an almost three-month low of 24916.  The sharp sell-off drove the index near the ascending trend line, however, the price turned higher after challenging the 200-day simple moving average (SMA), paring some losses. The momentum indicators are supportive of the reverse to the upside, with the RSI rising above the oversold zone to move towards the 50 level, while the stochastic oscillator is ready to post a bullish crossover with the blue %K [..]

post-image

Technical Analysis – Japan 225 index holds at 3-week lows; retains upside outlook

Posted on October 9, 2018 at 12:31 pm GMT

The Japan 225 index has been underperforming over the last three days and today recorded a three-week low of 23315. The aggressive selling scenario is confirmed by the technical indicators; the RSI dropped below the positive area, after the bounce off the overbought zone, while the MACD is falling below the trigger line but stands above the zero line. Should the index manage to strengthen the negative momentum, the next immediate support could come near the 23116 barrier. A break below this level [..]

post-image

Technical analysis – US 500 index flirts with all-time highs, but RSI signaling pullback

Posted on October 4, 2018 at 2:16 pm GMT

The US 500 index posted considerable gains in recent weeks, trading above a medium-term uptrend line drawn from the lows of April 2, as well as above the 50- and 200-day simple moving averages (SMAs), signaling that the outlook remains positive. The index touched a fresh all-time high of 2940.7 on September 21, and came within breathing distance of that level again on October 3, before pulling back somewhat. Although the overall picture is still bullish, momentum oscillators suggest that [..]

post-image

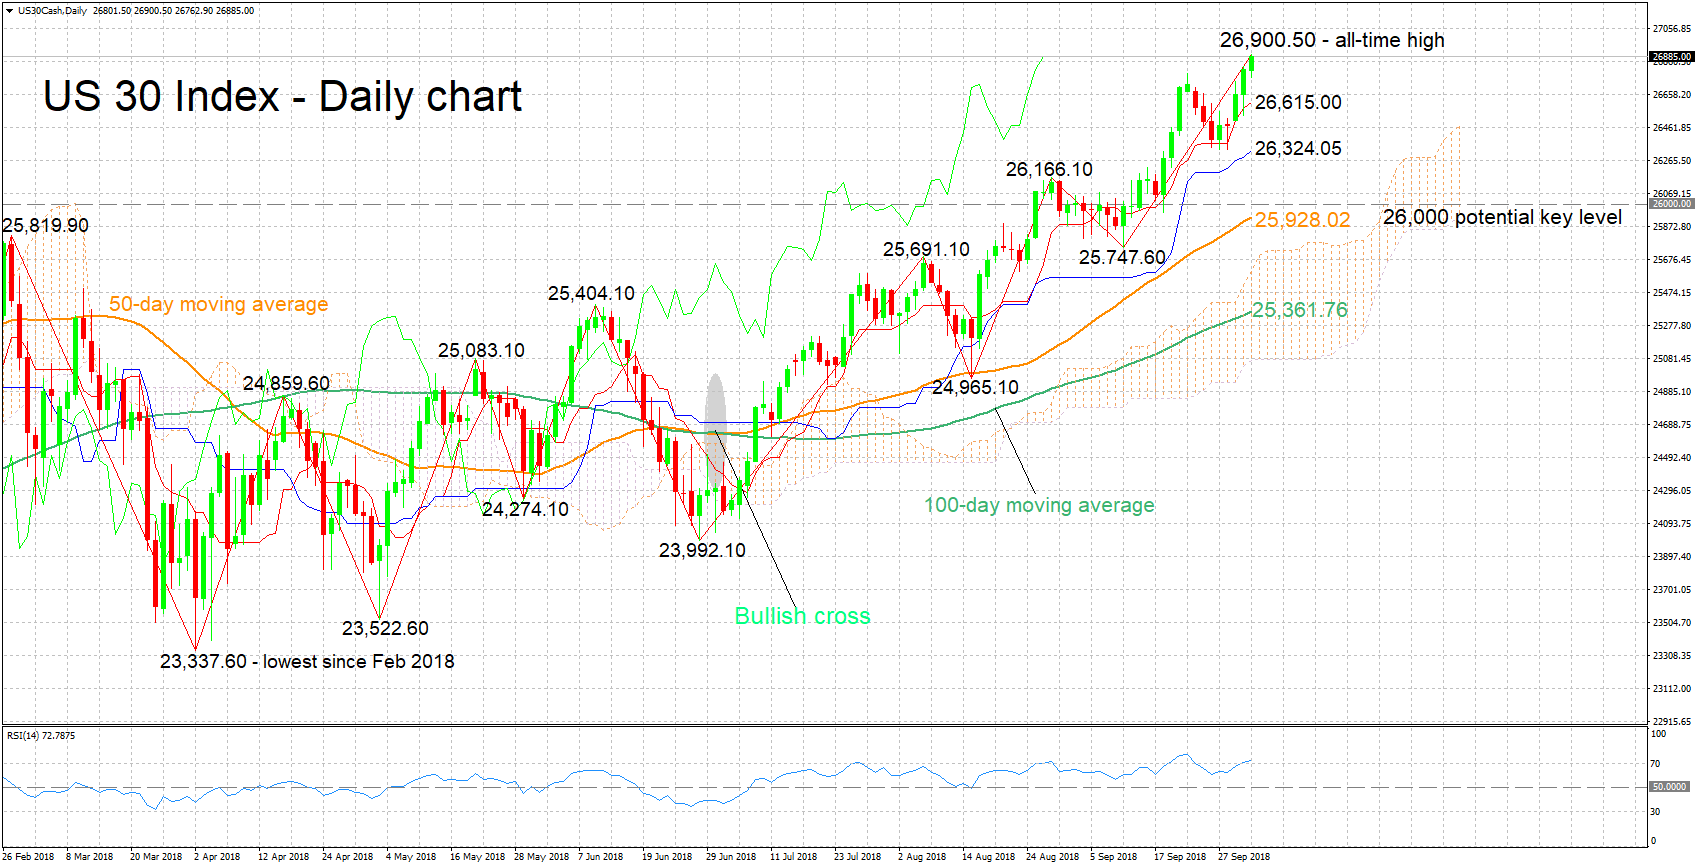
Technical Analysis – US 30 index posts fresh record high to eye 27,000 mark; RSI overbought

Posted on October 3, 2018 at 1:01 pm GMT

The US 30 index (Dow Jones Industrial Average) hit a fresh all-time high of 26,900.50 in pre-market trading on Wednesday, while it is currently in proximity to this peak. Adding to the conviction for a bullish bias are the positively-aligned Tenkan- and Kijun-sen lines and the RSI which is heading higher. Notice though that the latter has entered overbought territory above 70; a correction is not to be ruled out. Further gains may meet resistance around the 27,000 mark which [..]

post-image

Technical Analysis – IBEX 35 pares some losses; still in downward sloping channel

Posted on September 27, 2018 at 1:47 pm GMT

The IBEX 35 index was underperforming in the previous sessions, while today, the price is erasing some losses and is ready to set a bullish day. However, the index remains below the 23.6% Fibonacci retracement level of the downleg from 11190 to 9100, near 9590. The technical indicators, though, are flattening near their neutral levels. The RSI indicator holds slightly above 50 level and the MACD oscillator stands above its trigger line. If price action jumps above the 50-day simple moving average, there is [..]

post-image

Technical Analysis – US 500 index achieves new all-time high; holds in upward sloping channel

Posted on September 21, 2018 at 11:39 am GMT

The US 500 index reached a fresh all-time high of 2939.20 earlier today and has been stuck in a channel titled to the upside since April 2. The bullish picture seems to be overstretched as the RSI indicator is flattening near the 70 level, however, the MACD oscillator posted a bullish crossover with its trigger line in the positive zone. More upside movements and a surpass above the aforementioned all-time high could challenge the next strong psychological level of 3000. [..]

Risk Warning: Your capital is at risk. Leveraged products may not be suitable for everyone. Please consider our Risk Disclosure.