XM does not provide services to residents of the United States of America.

Indices

post-image

Technical Analysis – US 100 index recovers notable losses in short term
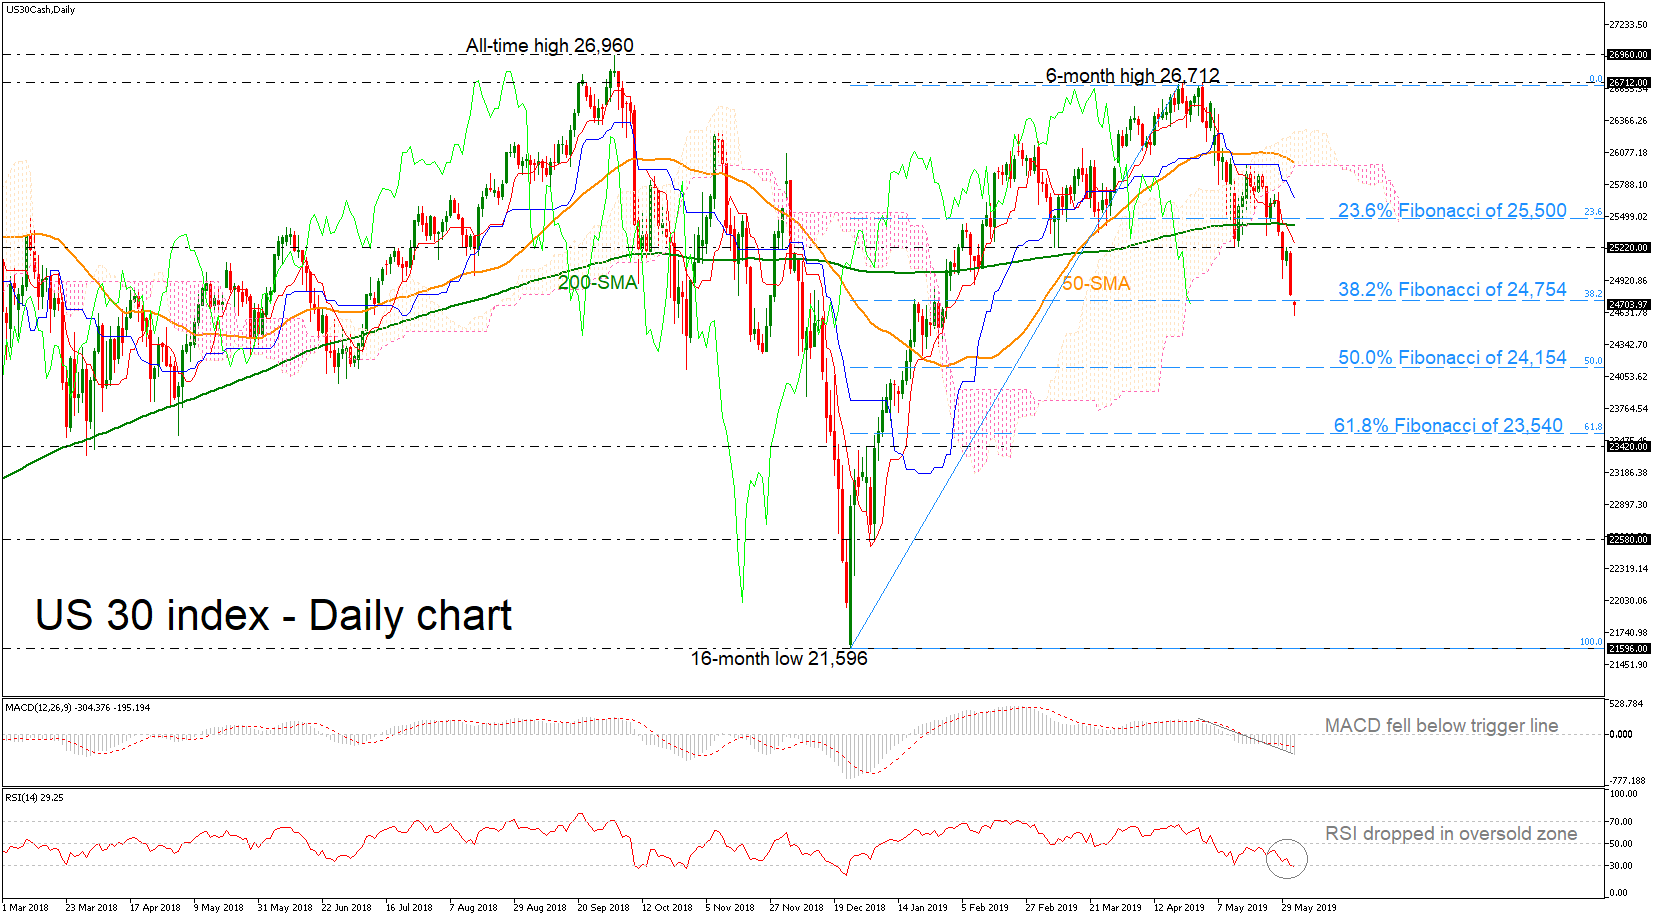
Posted on June 10, 2019 at 12:19 pm GMT

The US 100 index advanced considerably in the previous week, penetrating the Ichimoku cloud following the rebound on the 6930 support level. However, the bulls have so far been unable to push the price above the 50-day simple moving average (SMA), but the technical indicators are moving north. The MACD surpassed the trigger line in the negative area while the RSI climbed above the 50 level. In case of further advances, a first line of resistance may be found near [..]

post-image

Technical Analysis – US 500 index buying interest in progress

Posted on June 5, 2019 at 1:14 pm GMT

The US 500 stock index has rebounded somewhat after falling to a three-month low of 2728.50 and the momentum indicators suggest that the market sentiment might get better as the RSI is reversing back to the upside and the MACD also looks to be changing direction, moving down to meet its red signal line in the negative zone. Should bullish dynamics dominate, the market might revisit the lower surface of the Ichimoku cloud and the flat Kijun-sen line currently at 2840. [..]

post-image

Technical Analysis – US 30 index opens with gap down; flirts with 4-month low

Posted on June 3, 2019 at 12:32 pm GMT

The US 30 index futures opened with negative gap today below the 38.2% Fibonacci retracement level of the upward movement from the 16-month low of 21,596 to the 6-month high of 26,712 near 24,754. The index is on the back foot, recording more than four-month low (24,606), and the technical indicators suggest that the market could ease a little bit more in the short-term; the MACD is falling in the negative zone, while the RSI looks to be losing momentum near oversold [..]

post-image

Technical Analysis – GER30 index breaches key support

Posted on May 31, 2019 at 12:12 pm GMT

GER30 index dived below a former key support area of 11,700 on Friday, signalling the continuation of the bearish action. The RSI is backing this view as well as the indicator keeps losing ground under its 50 neutral mark, while the MACD is giving extra negative warnings as long as it extending negative momentum below its red signal line. Traders however could wait for a decisive close below the 200-day simple moving average and the Ichimoku cloud before rapidly increasing [..]

post-image

Technical Analysis – US Dollar Index approaches 2-year high again; positive profile in long term

Posted on May 30, 2019 at 9:24 am GMT

The US dollar index is edging higher towards the two-year high of 98.25 over the last three consecutive days, remaining well above the long-term ascending trend line and the moving averages. The short-term bias is tilted to the upside as the RSI indicator is turning marginally higher in the positive region, while the trigger line of the MACD oscillator is rising in the positive region. If the index moves higher, the two-year high of 98.25 could attract traders’ attention once again and any violation above this [..]

post-image

Technical Analysis – US 500 index turns lower between SMAs

Posted on May 27, 2019 at 1:31 pm GMT

The US 500 stock index has declined considerably from the fresh all-time high of 2960.48, penetrating the Ichimoku cloud in the daily timeframe. The bearish correction picture in the short term is further supported by the MACD, which is falling below its red signal line and the RSI indicator which is turning slightly lower. Should prices move lower, support could come at the 23.6% Fibonacci retracement level of the upleg from 2332 to 2960.48 around 2813 again. Below that, the 2784 is another major support before [..]

post-image

Technical Analysis – US Dollar Index tries to hit 23-month peak; remains bullish in medium term

Posted on May 22, 2019 at 12:57 pm GMT

The US dollar index is still rising above the 50-day moving average, edging towards the 23-month high of 98.05 achieved on April 25. However, the short-term bias is tilted to the downside as the RSI indicator is turning marginally lower in the positive region, while the stochastic oscillator posted a bearish crossover within the %K and %D lines in the overbought territory, indicating an overreached rally. If the price posts a bearish retracement as the momentum oscillators signal, support is coming at the 96.85 level, which stands near [..]

post-image

Technical Analysis – US 30 index eases inside Ichimoku cloud; fails to improve

Posted on May 20, 2019 at 1:01 pm GMT

The US 30 index is trading below the six-month high of 26,712, struggling within the Ichimoku cloud and the between the 50- and 200-simple moving averages (SMAs). The index is on the back foot and the technical indicators suggest that the market could ease a little bit in the short-term; the MACD is flattening in the negative zone, while the stochastic looks be losing momentum. In case of a correction lower, preliminary support may be initially found near 25,500 which is where the 23.6% Fibonacci retracement [..]

post-image

Technical Analysis – UK 100 index rises near 40-day average

Posted on May 16, 2019 at 11:54 am GMT

UK 100 stock index (FTSE 100) has advanced considerably over the last couple of days after touching the 7124 support, remaining below the 50-day average. The stochastic oscillator is confirming this view, as it is heading north, approaching the overbought territory. If the price manages more bullish actions and surpasses successfully the 50-SMA, immediate resistance would come from the 61.8% Fibonacci retracement level of the downleg from 7900 to 6533 around 7380. Further up, the index could rest around the 7530-7560 resistance area. On [..]

post-image

Technical Analysis – US 100 index corrects lower, but broader picture still positive

Posted on May 10, 2019 at 12:44 pm GMT

The US 100 index retreated this week, after reaching a new all-time high in late April. However, the bears have so far been unable to push the price below the 50-day simple moving average (SMA), and as long as that remains the case, the broader outlook still seems positive. In case of further declines, a first line of support may be found near the crossroads of the 7,470 zone and the 50-day SMA, currently at 7,493. A decisive break below [..]

Risk Warning: Your capital is at risk. Leveraged products may not be suitable for everyone. Please consider our Risk Disclosure.