XM does not provide services to residents of the United States of America.

Indices

post-image

Technical Analysis – GER 40 index in positive mood ahead of ECB rate decision
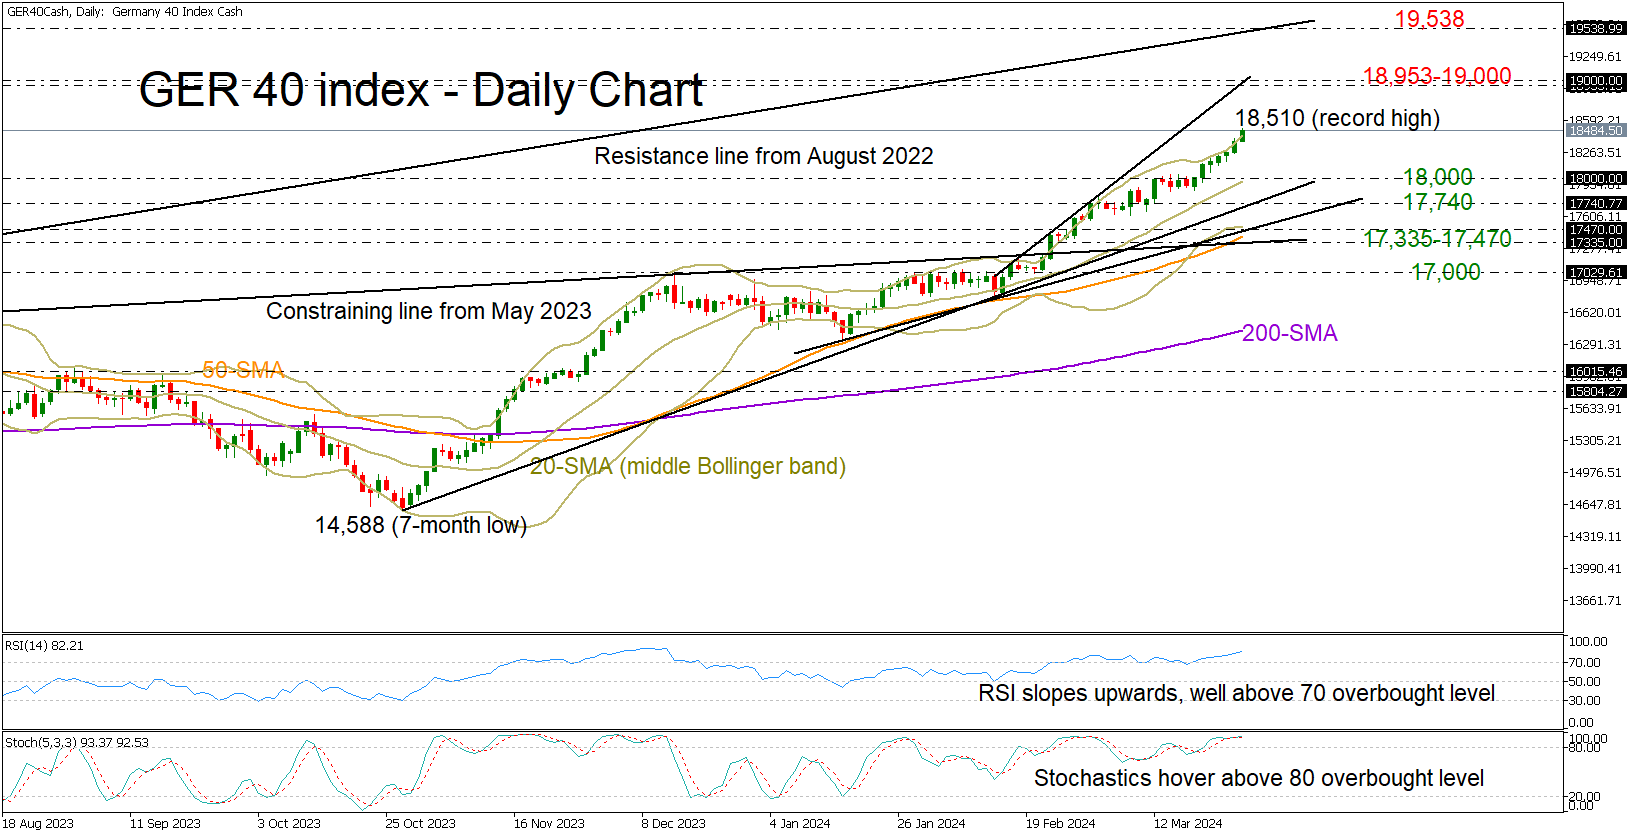
Posted on June 6, 2024 at 8:21 am GMT

German 40 index strives to exit bearish formation before a widely expected rate cut Short-term risk skewed to the upside, but confirmation signal could come above 18,672   The German 40 index started Thursday’s session on a positive note, aiming to extend its latest upturn above its 20-day simple moving average (SMA) and out of the short-term bearish channel at 18,672. All eyes will be on the ECB policy meeting today and particularly on the central bank’s guidance on future rate cuts [..]

post-image

Technical Analysis – Are there any bullish signals in the US 500 index?

Posted on June 3, 2024 at 3:37 pm GMT

US 500 index holds above 20- and 50-day EMAs Technical indicators are not in the bearish area yet A surge above 5,340 is needed for a positive outlook revision   The US 500 stock index (cash) rose slowly to reach an intra-day high of 5,302 on Monday, only to immediately relinquish its mild gains and trade slightly negative below April’s bar of 5,281. Friday’s bounce off the 20- and 50-day exponential moving averages (SMAs) questioned the case of a bearish trend [..]

post-image

Technical Analysis – US 30 index on the slide for the second week

Posted on May 30, 2024 at 3:31 pm GMT

US 30 index creates a double top pattern near 40,000; slips below key support levels A step beneath 37,847 could motivate more selling US Q1 GDP figures revised down; core PCE inflation next on the agenda   The US 30 index (cash) has been suffering the most on Wall Street over the past two weeks. Having topped twice near the 40,000 psychological mark last Monday, the index lost around 4.4% to trade near 38,050 ahead of Friday’s core PCE inflation data. [..]

post-image

Technical analysis – US 500 index slips after all-time high but holds within bullish area

Posted on May 23, 2024 at 2:53 pm GMT

US 500 prints new record high thanks to Nvidia’s upbeat earnings Better-than-expected US PMIs weigh on the market Technical outlook positive above 5,280   The US 500 stock index has been moving from record high to record high over the past week, surging to a new high of 5,350 on Thursday following Nvidia’s upbeat Q1 earnings report. Upbeat US business PMI figures, however, reminded investors that rate cuts could come with some delay, initiating a decline towards the tentative ascending [..]

post-image

Technical Analysis – UK 100 index swings to all-time high

Posted on May 9, 2024 at 12:02 pm GMT

UK 100 hits record high after the BoE rate decision; up 8% year-to-date Next target at 8,500, but fears of an overbought market might delay rally The UK 100 stock index (cash) has been performing incredibly well over the past four months, staging another exponential rally this week to unlock an all-time high of 8,393 on Thursday. The index has surpassed a couple of targets, including the 2023 top of 8,045 that temporarily ceased bullish actions on April 12. The spotlight [..]

post-image

Technical Analysis – US 500 index might hit lower levels after Tuesday’s slump

Posted on May 1, 2024 at 2:49 pm GMT

US 500 index exposed to more downside after Tuesday’s pullback Short-term risk is negative. Will the bears crack the floor at 4,965-5,000?   The US 500 stock index (cash) traded flat at the start of the US open as investors waited for the FOMC policy announcement today at 18:00 GMT. Despite the current muted tone in the market, the short-term outlook does not look promising, especially after the price got hammered near the resistance line from April’s record high for [..]

post-image

Technical Analysis – US 500 index retreats from record high

Posted on April 2, 2024 at 3:48 pm GMT

US 500 faces downside pressures for the second consecutive day More weakness possible, but key support levels are nearby   The US 500 stock index (cash) opened negative on Tuesday, strengthening its negative momentum towards its 20-day exponential moving average (EMA), which has been buffering downside movements since the start of the year, around 5,185. With the RSI marking a new low below an important support area and the stochastic oscillator decelerating, the odds for a bearish impulse have increased. [..]

post-image

Technical Analysis – GER 40 index marks highs after highs

Posted on March 27, 2024 at 4:46 pm GMT

German 40 index hits all-time high Uptrend shows ongoing strength, but a pause is likely   The German 40 index has been having an exceptional performance so far in 2024, gaining more than 10% to unlock an all-time high of 18,510 on Wednesday. The ongoing positive trend has yet to show any cracks, but with the price marking its 10th consecutive green week near the upper Bollinger band and the momentum indicators pointing to overbought conditions, the bears could be around the [..]

post-image

Technical Analysis – Will JP 225 index continue its record rally?

Posted on March 20, 2024 at 1:43 pm GMT

JP 225 index flirts with all-time highs Short-term technical signals remain encouraging   Japan’s 225 stock index (cash) is on the rise again, aiming to revive its five-month-old positive trend above the March record high of 40,564 after finding support near the 38,310 area. The technical signals favor the upward move in the price as the RSI is sloping northwards and is still some distance off its 70 overbought mark. The stochastic oscillator continues to trend up, and the MACD is looking [..]

post-image

Technical Analysis – US 100 stock index at risk of double top

Posted on March 12, 2024 at 2:01 pm GMT

US 100 stock index forms bearish structure The market could balance selling forces above 17,800   The US 100 stock index (cash) seems to have formed a bearish double top pattern within a rising channel and around the peak area of 18,338. The bears will have to successfully complete that negative pattern below the 17,800-17,914 neckline to visit the 50-day exponential moving average (EMA) and the 23.6% Fibonacci of 17,389. Slightly lower, the constraining ascending line from January 2023 might act as a safety [..]

Risk Warning: Your capital is at risk. Leveraged products may not be suitable for everyone. Please consider our Risk Disclosure.