XM does not provide services to residents of the United States of America.

Indices

post-image

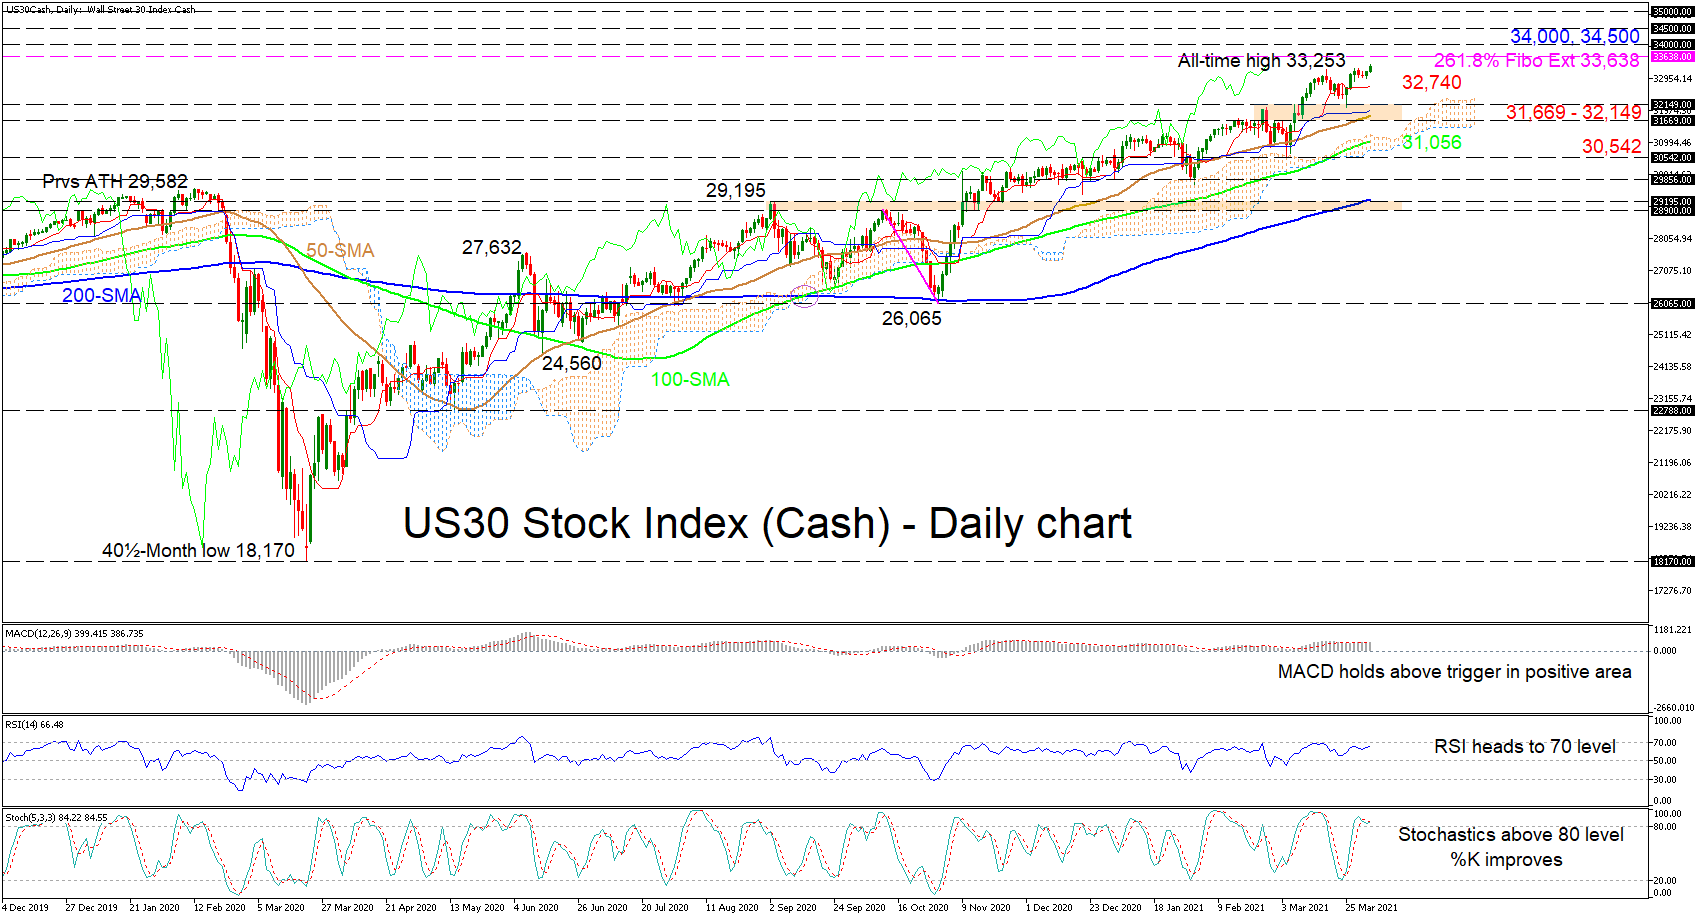
Technical Analysis – US 30 index consolidates around its highs; retains bullish tone

Posted on April 23, 2021 at 1:28 pm GMT

The US 30 stock index (Cash) seems caught within a minor ranging market after retreating slightly below its all-time high of 34,251. The simple moving averages (SMAs) are shielding the broader bullish bias; however, the flattening Ichimoku lines are reflecting the evaporation of directional momentum. The short-term oscillators are transmitting conflicting signals in sentiment but are slightly skewed to the downside. The MACD is below its red trigger line and is heading lower in bearish territory, while the sustained negative [..]

post-image

Technical Analysis – JP 225 index reveals possible head & shoulders pattern

Posted on April 22, 2021 at 2:10 pm GMT

Japan’s 225 index (Cash) appears to have shaped what looks to be like a head and shoulders reversal pattern after rallying to a multi-decade high of 30,711. The price has gradually eased off its fresh top, plotting overall lower highs but via a rather sideways ranging demeanour. The bullish simple moving averages (SMAs) are shielding the prevailing uptrend; however, the decelerating slope of the 50-day SMA is transmitting warning signs for positive sentiment. We can see that the index confirmed [..]

post-image

Technical Analysis – US 500 index ready to elevate all-time high

Posted on April 19, 2021 at 2:48 pm GMT

The US 500 stock index (Cash) is sustaining its bullish tone above the rising Ichimoku lines, which are nourishing the price’s attempts to steer higher. Additionally, the advancing simple moving averages (SMAs) are shielding the positive structure. The short-term oscillators are reflecting the resilience of the index to survive attempts to retrace to a certain degree. The MACD is keeping above its red trigger line in the positive region, while the RSI is sustaining its recent nudge into the overbought [..]

post-image

Technical Analysis – US 30 index maintains relentless ascent and breaches 34,000 hurdle

Posted on April 16, 2021 at 1:02 pm GMT

The US 30 stock index (Cash) seems to guarantee that the stable hike, which has overstepped the 34,000 mark, is here to stay. The unwavering simple moving averages (SMAs) are firmly defending the positive structure, while the rising Ichimoku lines and the short-term oscillators are echoing an absence of gravity in the current picture. The MACD, in the bullish region, is persisting above the fairly stabilised red trigger line, while the RSI is improving in overbought territory. Furthermore, the stochastic [..]

post-image

Technical Analysis – US 100 index heals wounds to reclaim record highs

Posted on April 15, 2021 at 1:32 pm GMT

The US 100 stock index (cash) surrendered its gains on the four-hour chart shortly after touching a new record high of 14,036 on Wednesday. The index is currently trying to recover the lost ground, with the RSI and the Stochastics promoting the bullish attempt as the former has refused to dive below its 50 neutral mark and the latter has rebounded from the oversold territory. A close above the all-time high of 14,036 could fade near the 14,200 psychological level. [..]

post-image

Technical Analysis – US 500 index’s negative pressures threaten latest rally

Posted on April 12, 2021 at 8:23 am GMT

The US 500 stock index (Cash) has been improving steadily lately, although it appears the progress in the price may suffer a minor setback as increasing bearish forces are contesting the uptrend. The positive bias is being endorsed by the rising simple moving averages (SMAs), however, the short-term oscillators are promoting a slightly different picture. Currently, the oscillators are demonstrating that positive momentum is slightly waning, validating the marginal pullback in the price. The MACD is far above the zero [..]

post-image

Technical Analysis – US 30 index takes a breather around 123.6% Fibonacci extension

Posted on April 8, 2021 at 3:44 pm GMT

The US 30 stock index (Cash) is currently edging sideways around the mostly neutral red Tenkan-sen line however, the bullish bias remains potent. The climbing simple moving averages (SMAs) are safeguarding the bigger bullish structure, while the relatively stable Ichimoku lines are reflecting a period of paused directional drive. The short-term oscillators are transmitting signals of waning positive momentum; however this is not sufficient to suggest a more aggressive pullback in the price. The MACD is still in the bullish [..]

post-image

Technical Analysis – GER 30 index set for a bearish correction after new record high

Posted on April 7, 2021 at 2:59 pm GMT

The German 30 index (cash) posted its first red candle after its seven-day-old bullish streak halted at a new record high of 15,364 on Tuesday. The RSI and the Stochastics seem to have peaked within the overbought area too, justifying the recent pullback in the price. Despite that, the upward-sloping simple moving averages (SMAs) and the trading above the Ichimoku cloud keep embracing the broader positive trajectory in the market – of course as long as the price continues to [..]

post-image

Technical Analysis – US 500 index flirts with all-time high; holds above SMAs

Posted on April 5, 2021 at 8:45 am GMT

The US 500 index is holding around the fresh all-time high above the 4,000 handle, remaining well above the daily simple moving averages (SMAs) and the Ichimoku cloud. The MACD is hovering above the trigger line in the positive territory, while the RSI looks to be turning slightly lower above the neutral level of 50. If there is a move higher again, the index could flirt again with the record high of 4,047.72. A rise above this crucial line would [..]

post-image

Technical Analysis – US 30 index resumes bullish bias; upside risks improve

Posted on April 2, 2021 at 1:28 pm GMT

The US30 stock index (Cash) has currently crept over the all-time high of 33,253 and is headed for the 33,638 level, which happens to be the 261.8% Fibonacci extension of the down leg from 28,900 to 26,065. The sturdy advancing simple moving averages (SMA) are defending the bullish structure, while positive sentiment appears to be picking up. The Ichimoku lines are conveying the above mentioned view point – as are the short-term oscillators – and are starting to turn upwards [..]

Risk Warning: Your capital is at risk. Leveraged products may not be suitable for everyone. Please consider our Risk Disclosure.