XM does not provide services to residents of the United States of America.

Cryptocurrencies

post-image

Technical Analysis – XRPUSD capped by its 200-SMA; bullish bias holds

Posted on March 31, 2022 at 7:35 am GMT

XRPUSD (Ripple) has been gaining ground after its downtrend halted at the six-month low of 0.5500. Although the short-term picture has been improving for the cryptocurrency, the price is currently being held down by its 200-day simple moving average (SMA). The short-term oscillators reinforce the view that bullish forces remain in control. Specifically, the RSI is hovering above its 50-neutral threshold, while the MACD histogram is currently beyond both zero and its red signal line. Should the price continue its [..]

post-image

Bitcoin storms to 2022 peak dragging broader crypto markets higher – Cryptocurrency News

Posted on March 28, 2022 at 2:30 pm GMT

Bitcoin price has been rallying in the past week, trading comfortably above the $47,000 mark in the current trading session. This recent uptrend is largely attributed to a wave of short position liquidations on cryptocurrency exchanges as transaction volume exceeded $120 billion in the past 24 hours. Moreover, most major altcoins exploded to fresh highs, benefiting from Bitcoin’s significant upside breakout. Is this the start of a bullish cycle for cryptocurrencies even though the dust from the war has not settled yet? [..]

post-image

Technical Analysis – ETHUSD ticks upwards but its rangebound pattern holds

Posted on March 24, 2022 at 8:27 am GMT

ETHUSD (Ethereum) has been moving sideways since the beginning of 2022, when its downside trajectory halted. However, the technical picture seems to be improving for the cryptocurrency, with the ascending 50-day simple moving average (SMA) endorsing a bullish near-term bias. The momentum indicators suggest that bullish forces have gained the upper hand. Specifically, the RSI is hovering above its 50-neutral mark, while the MACD histogram is currently beyond zero and its red signal line. Should buying interest intensify further, the recent [..]

post-image

Bitcoin extends sideways move as investors digest Fed’s tightening and war developments – Cryptocurrency News

Posted on March 21, 2022 at 4:51 pm GMT

The ongoing war between Russia and Ukraine has attracted significant buying interest for Bitcoin and most major cryptocurrencies. On the one hand, Russian oligarchs are likely using cryptocurrencies as a wealth preservation tool and a way to evade financial sanctions, while the Ukrainian side is receiving cryptocurrency donations as humanitarian aid. Therefore, considering the surging demand driven by diverse factors, why does Bitcoin fail to rally? Regulatory issues continue to undermine crypto transactions The Central Bank of Russia (CBR) advised major Russian [..]

post-image

Technical Analysis – BTCUSD sets up for next round of volatility

Posted on March 17, 2022 at 4:31 pm GMT

BTCUSD (Bitcoin) has been following a neutral trajectory since the end of January, driving back and forth between the 45,855 and 32,950 boundaries, though a symmetrical triangle started to become evident in March, suggesting that the next round of volatility could soon commence. The momentum indicators provide little clue about which direction the market will take as the RSI keeps fluctuating around its 50 neutral mark, and the MACD is stable just below zero. Yet as long as the former [..]

post-image

Bitcoin pinned around $39,000 as Ukraine war proves a blessing and a curse – Cryptocurrency News

Posted on March 15, 2022 at 3:45 pm GMT

Bitcoin has been trading in a range since late January when fears about sky-high inflation took hold over the markets and tensions between Russia and Ukraine first started to escalate. The sideways pattern isn’t showing any signs of breaking up, so why is the price so unusually disciplined at such a tumultuous period for financial markets? The halving effect The price of Bitcoin – still the largest cryptocurrency by market cap – exploded higher in 2020 and 2021. Whilst the [..]

post-image

Technical Analysis – XRPUSD aims for a bullish triangle breakout

Posted on March 9, 2022 at 4:35 pm GMT

XRPUSD (ripple crypto) has been oscillating back and forth within the 0.7000 – 0.800 region so far this month, of what looks to be now transforming to a symmetrical triangle. While that kind of triangle is a neutral signal for the market, and the bearish crosses within the simple moving averages (SMAs) on the four-hour chart are dashing hopes for any trend improvement, the good news is that the price is set for a close above the triangle’s upper trendline [..]

post-image

Technical Analysis – LTCUSD shows bullish tendency after February’s plunge

Posted on March 2, 2022 at 3:19 pm GMT

LTCUSD (Litecoin) has been trending northwards since the plunge to a multi-year low of 91.43 in the four-hour chart last week, with the price topping its latest bullish action at 116.00 on Monday before correcting lower again. Discouragingly, the price has slid below the 111.00 region, which has been balancing downside pressures the past few sessions, raising speculation that the latest pullback could gain extra legs, but the market is currently trying to recoup that setback. Nevertheless, traders may not [..]

post-image

Technical Analysis – BTCUSD descending triangle breakout could be nearing

Posted on September 24, 2019 at 2:48 pm GMT

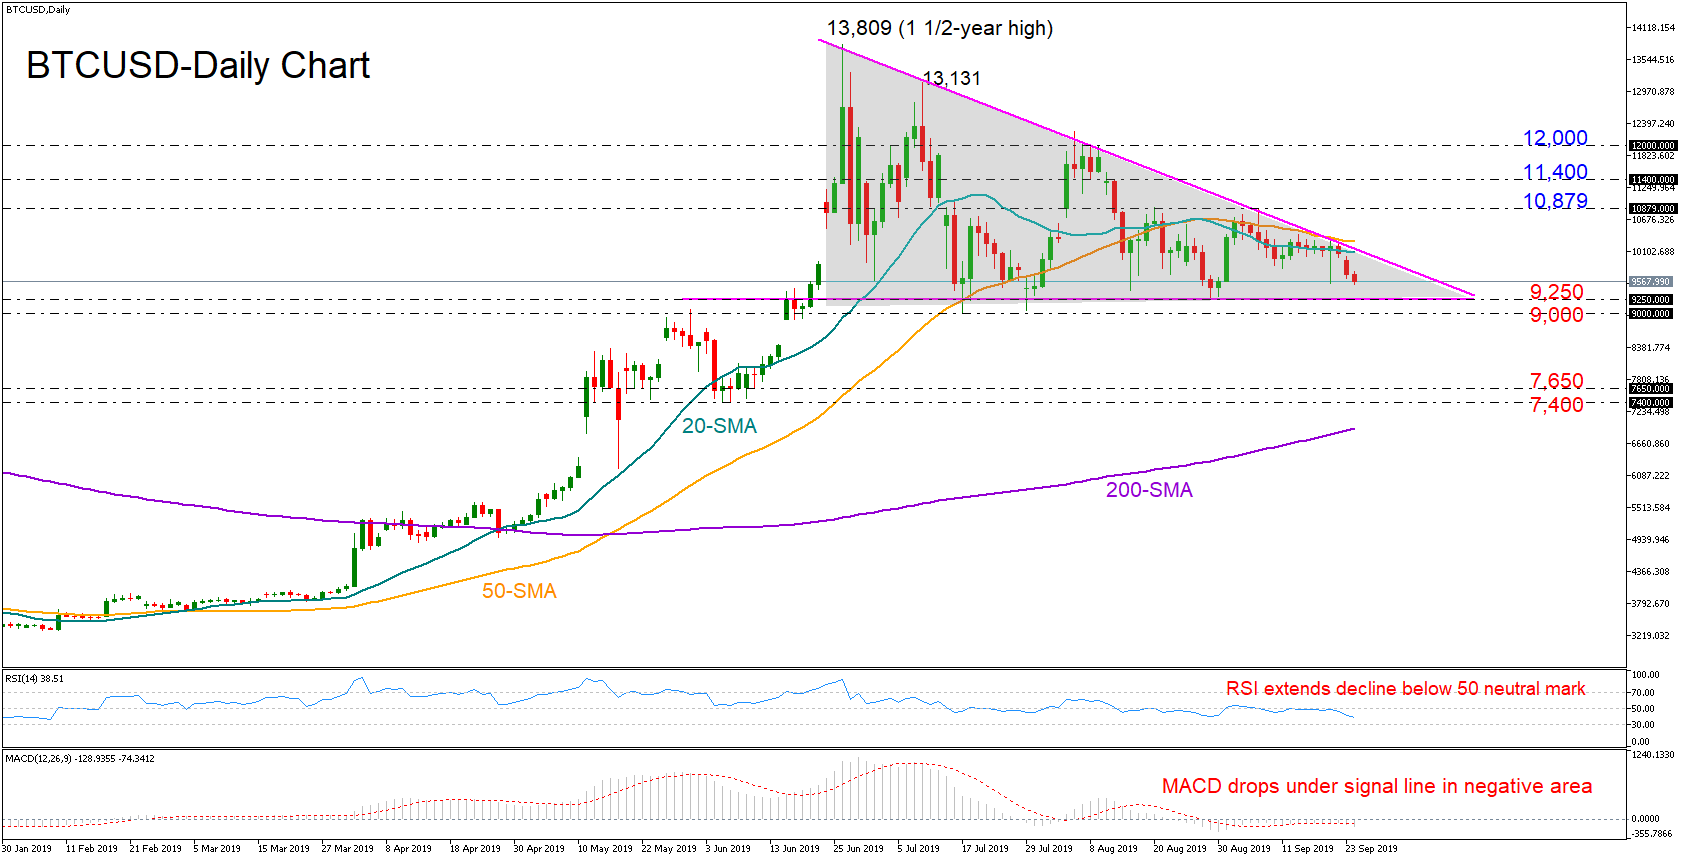
BTCUSD (Bitcoin) has been gradually making lower highs since June’s spike to the 1½-year high of 13,809, what now looks to be a descending triangle with a support line around 9,250. The technical indicators are currently favoring a bearish picture for the short-term, as the RSI is maintaining a downward slope under its 50 neutral mark and the MACD seems to be gaining negative momentum below its red signal line. The base around 9,250 could reject downside corrections but if [..]

post-image

Technical Analysis – BTCUSD exposed to downside corrections

Posted on September 6, 2019 at 1:55 pm GMT

BTCUSD (Bitcoin) staged a stunning upside reversal around the 9,300 support area, with the price surging back above the 100-period exponential moving average (EMA) and towards two-week highs. Buyers are currently pushing efforts to overcome the 38.2% Fibonacci of 10,837 of the downleg from 13,809 to 9.011, a break of which could see the retest of the 11,130 barrier. Moving higher, the 50% Fibonacci of 11,398 could next captivate trader’s attention and trigger another bullish action towards the 61.8% Fibonacci [..]

Risk Warning: Your capital is at risk. Leveraged products may not be suitable for everyone. Please consider our Risk Disclosure.