Season's Greetings from XM and best wishes for the upcoming winter holidays. View Holiday Schedule
Support
How can we help?
Choose how you’d prefer to receive support.
Live Chat
Live Chat Terms
By using our LiveChat, you agree that any personal data provided via LiveChat will be processed by us, as per our Privacy Policy, for the purpose of receiving assistance from our Customer Experience team.
We’re excited to announce our second contribution in the Singaporean community, through the Singapore Red Cross (SRC) ElderAid community, a humanitarian organisation dedicated to combating [..]
We’re excited to announce our second contribution in the Singaporean community, through the Singapore Red Cross (SRC) ElderAid community, a humanitarian organisation dedicated to combating [..]
There is a reason why over 10 Million Clients Choose XM for Forex Trading, Stock Indices Trading, Commodity Trading, Stocks, Metals and Energies Trading.
There is a reason why over 10 Million Clients Choose XM for Forex Trading, Stock Indices Trading, Commodity Trading, Stocks, Metals and Energies Trading.
Licensed and Regulated Broker
The XM Group is licensed by ASIC in Australia (Trading.com Markets Pty Ltd), by CySEC in Cyprus (Trading Point of Financial Instruments Ltd), by the FSC in Belize (XM Global Limited) and by the DFSA (Trading Point MENA Limited), adhering to enhanced regulatory standards.
Globally Renowned
We have clients from over 190 countries and staff speaking over 30 languages. Our management has visited over 120 cities globally to understand clients’ and partners’ needs.
Focused on the Client
Size does not matter. At XM the client comes first regardless of net capital worth, account type or size of investment. All our clients receive the same quality services, the same execution, and the same level of support. XM was founded on these values, and that will not change.
Range of Trading Instruments
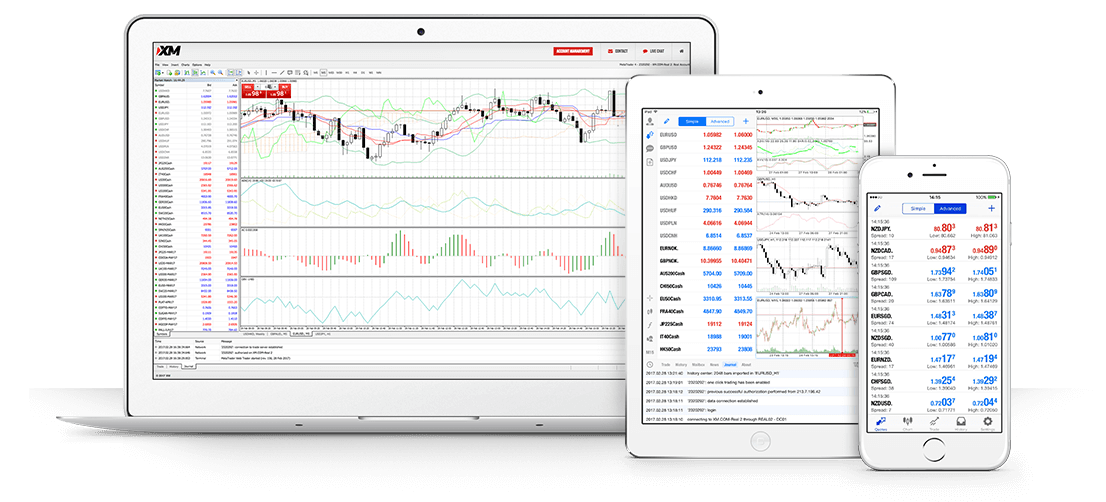
Our clients can choose to trade forex and CFDs on stock indices, commodities, stocks, metals and energies from the same trading account. With a wide range of trading instruments available from a single multi asset platform XM makes trading easier and efficient.
Transparent and Fair
At XM what you see is what you get, with no hidden terms. Be that pricing, execution or promotions. What we advertise is what we give our clients, regardless of the size of their investment.
Easy and Convenient
All our systems are built and updated with the client in mind. Starting from our account opening procedure, to managing your account, depositing or withdrawing funds and finally trading, it’s all straightforward simple and easy to use for all our clients.
Thank you for visiting XM!
Unfortunately, the product or service you’re trying to access isn’t available in your country.
What would you like to do?
Continue anyway
I’d like to view this content despite not being eligible to open an account.
See the content for my region
I’d like to visit the website of Trading.com, another entity of the group which is a registered Retail Foreign Exchange Dealer with the Commodities Futures Trading Commission and a member of the National Futures Association.
By choosing either option, I confirm that my decision to proceed was made independently, at my own initiative and no solicitation or recommendation has been made by XM or any other entity within the group.
Risk Warning: Your capital is at risk. Leveraged products may not be suitable for everyone. Please consider our Risk Disclosure.
XM Live Chat
Please enter your contact information. If you already have an XM account, please state your account ID so that our support team can provide you with the best service possible.