XM does not provide services to residents of the United States of America.

silver

post-image

Technical Analysis – Silver reverses up from 200-SMA; bears try to stop the gains

Posted on September 24, 2019 at 7:24 am GMT

Silver’s bears resurfaced around the 2017 high of 18.63 after a rally which bounced off the 200-period simple moving average (SMA). The move up began once the price of the metal gapped back above the 200-period SMA, following a brief close beneath it on September 13. The upward sloping 21- and 42-period SMAs indicate that the move up may stick around, with the 200-period SMA also backing the bigger positive outlook. That said, short-term oscillators paint a mixed picture, as [..]

post-image

Technical Analysis – Silver moves to multi-year highs; bears correct back down

Posted on September 5, 2019 at 3:54 pm GMT

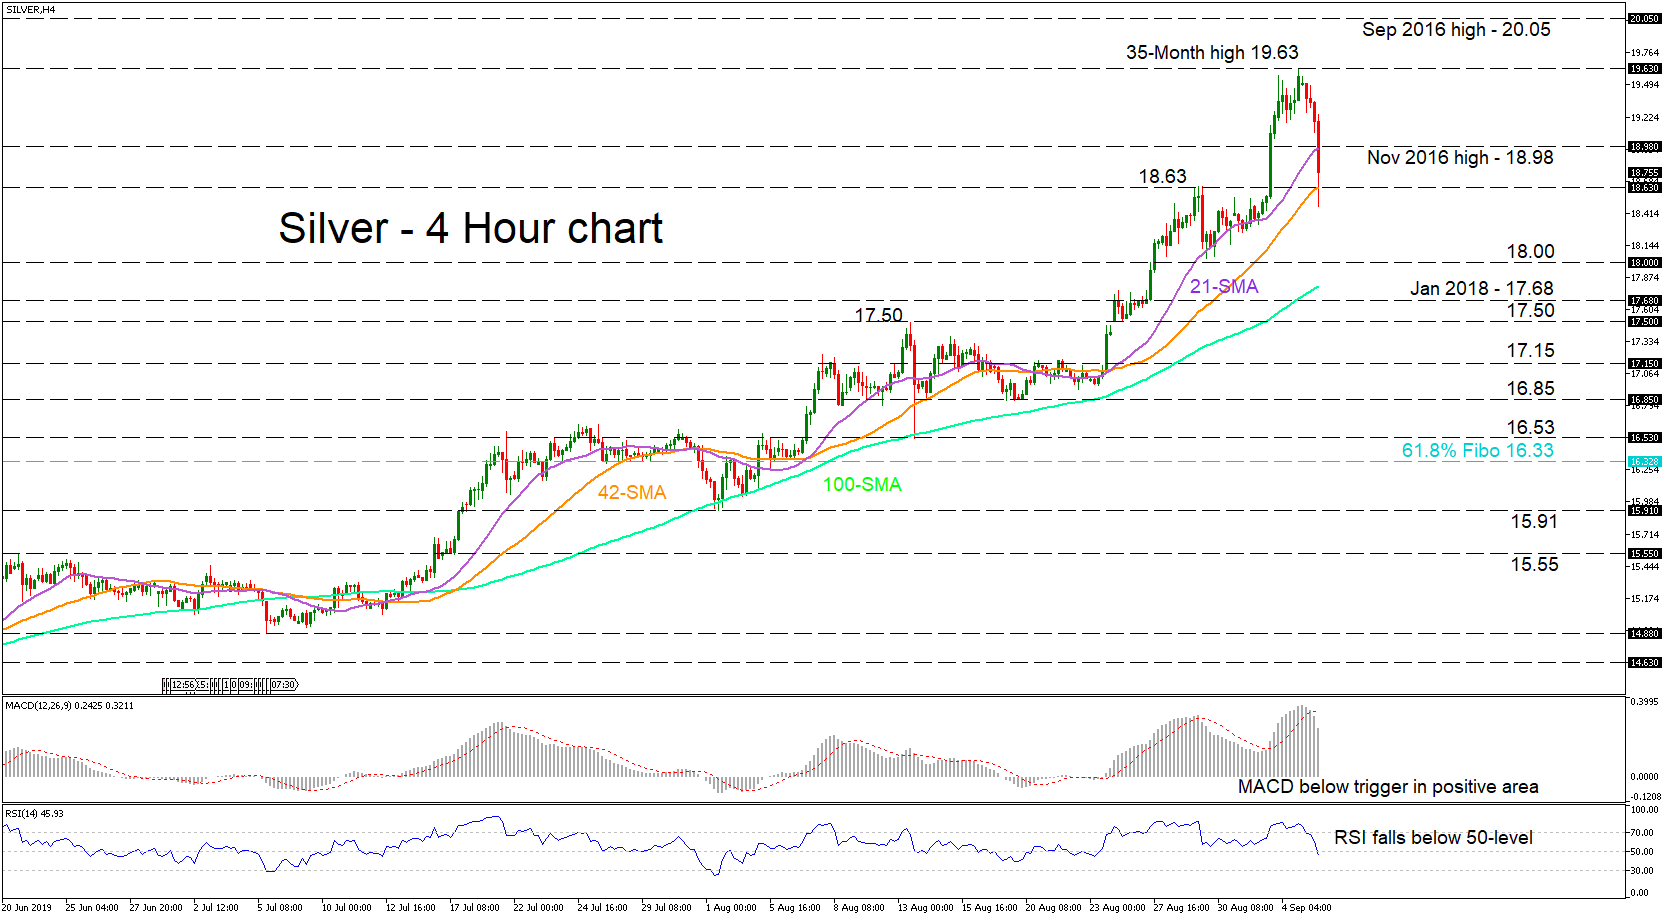
Silver’s bears erased the gains from the move up to a thirty-five-month high of 19.63. The pullback in the price of the metal moved through the 21-period simple moving average (SMA), which coincided with support from the November 2016 high of 18.98. The bears are now testing the 42-period SMA also residing with the swing high at 18.63. Momentum indicators reflect an increasing negative picture for the short-term. The MACD declined below its red trigger line in the positive region, [..]

post-image

Technical Analysis – Silver breaches 18.00 level; touches multi-year highs

Posted on August 28, 2019 at 2:25 pm GMT

Silver has been in a three-month rally from May 28. The metal surpassed the highs from the first months of 2018 as well as the 18.00 psychological number. The bulls continue to dominate, something also signaled by the momentum indicators’ bullish demeanor. The MACD is rising and distancing itself from its red trigger line in the positive territory, whilst the RSI despite moving further into the overbought region, has turned down. Although no clear reversal signals are apparent, caution for a short-term [..]

post-image

Technical Analysis – Silver meets 2018 peaks; bias neutral-to-bearish

Posted on August 16, 2019 at 10:12 am GMT

Silver topped near its 2018 peaks this week before pulling slightly back, with the MACD and the RSI pointing now to a neutral-to-bearish mode in the short-term; the former is increasing negative momentum below its red signal line, while the latter is fluctuating slightly below its 50 neutral mark. The support area around the 23.6% Fibonacci of 16.90 of the upleg from 15.03 to 17.49 will be closely watched if the decline extends. In case of a sharper downside move, the 38.2% Fibonacci and [..]

post-image

Technical Analysis – Silver prints new 14-month high above 138.2% Fibonacci extension level

Posted on August 7, 2019 at 2:50 pm GMT

Silver was unable to push below the 100-day simple moving average (SMA) at the beginning of the month. Silver found support from the Ichimoku cloud and the 100-day SMA was tested multiple times. After a short-term sideways move, the metal finally broke out of the cloud upwards and rallied past the previous thirteen-month high of 16.64, as well as the 138.2% Fibo extension level of the downleg from 16.20 to 14.28, printing a nearly fourteen-month new high of 17.08. A [..]

post-image

Technical Analysis – Silver aggressively rallied upwards; takes a breather near highs

Posted on July 25, 2019 at 9:44 am GMT

Silver advanced fiercely from July 9, towards a thirteen-month high of 16.635 and currently stands at a temporary stall, while buyers try to regain the reins in the short-term. Price is way over the Ichimoku cloud, and its Tenkan-sen average points north confirming the positive bias, whereas the Kijun-sen indicates the present stall. The 50-day simple moving average (SMA) has just crossed above the 200-day SMA. The MACD has soared above its trigger in the positive region, whereas the RSI [..]

post-image

Technical Analysis – Silver records new high, advancing above descending triangle

Posted on July 18, 2019 at 12:36 pm GMT

Silver is having one of its best trading sessions of this year, gaining strong momentum above the descending triangle that was holding since April 2017. This week the price continues to attract buying interest, with the price registering a fresh five-month high of 16.10. The technical indicators are still located in bullish area, with the MACD stretching further above its red trigger line and the RSI moving above 70. Yet the latter could also be an indication that the rally [..]

post-image

Technical Analysis – Silver climbs above 200-SMA in near term; still bearish in long-term

Posted on July 10, 2019 at 1:07 pm GMT

Silver prices came close to breaking the 14.90 level on Friday, finishing the day slightly above the 200-day simple moving average (SMA). According to the RSI, the market could maintain positive momentum in the short-term as the indicator is positively sloped marginally above its neutral threshold of 50, though the stochastic is creating a bullish cross within the %K and %D lines. On the upside, the price could attempt to hit the 15.55 resistance level, which if successfully broken the door [..]

post-image

Technical Analysis – Silver pulls back from 3-month high

Posted on June 21, 2019 at 11:47 am GMT

Silver reversed to the downside early on Friday but the 20-period simple moving average (SMA) in the four-hour chart managed to halt the bearish correction as it did a few days ago. The RSI and the MACD lost momentum as well, endorsing the negative move in the price. Yet, as long as both indicators remain in bullish area – the former above 50 and the latter above its red signal line – chances for a sharp downfall are weak. The 23.6% Fibonacci of 15.24 of the 14.27-15.43 upleg [..]

post-image

Technical Analysis – Silver rises after strong downfall from 16.20

Posted on March 8, 2019 at 12:48 pm GMT

Silver came close to breaking the 14.90 support level on Thursday, finishing the day at a two-and-a-half-month low of 14.96. According to the RSI, the market could shift higher as it is sloping slightly upwards in the negate zone, though the MACD oscillator is losing its strong downside momentum in the bearish territory. Also, the 20- and 40-simple moving averages completed a bearish crossover in the daily timeframe, confirming the recent negative view. If the price heads higher, immediate key resistance could come from the 38.2% Fibonacci [..]

Risk Warning: Your capital is at risk. Leveraged products may not be suitable for everyone. Please consider our Risk Disclosure.