XM does not provide services to residents of the United States of America.

commodities

post-image

Technical Analysis – Silver moves to multi-year highs; bears correct back down

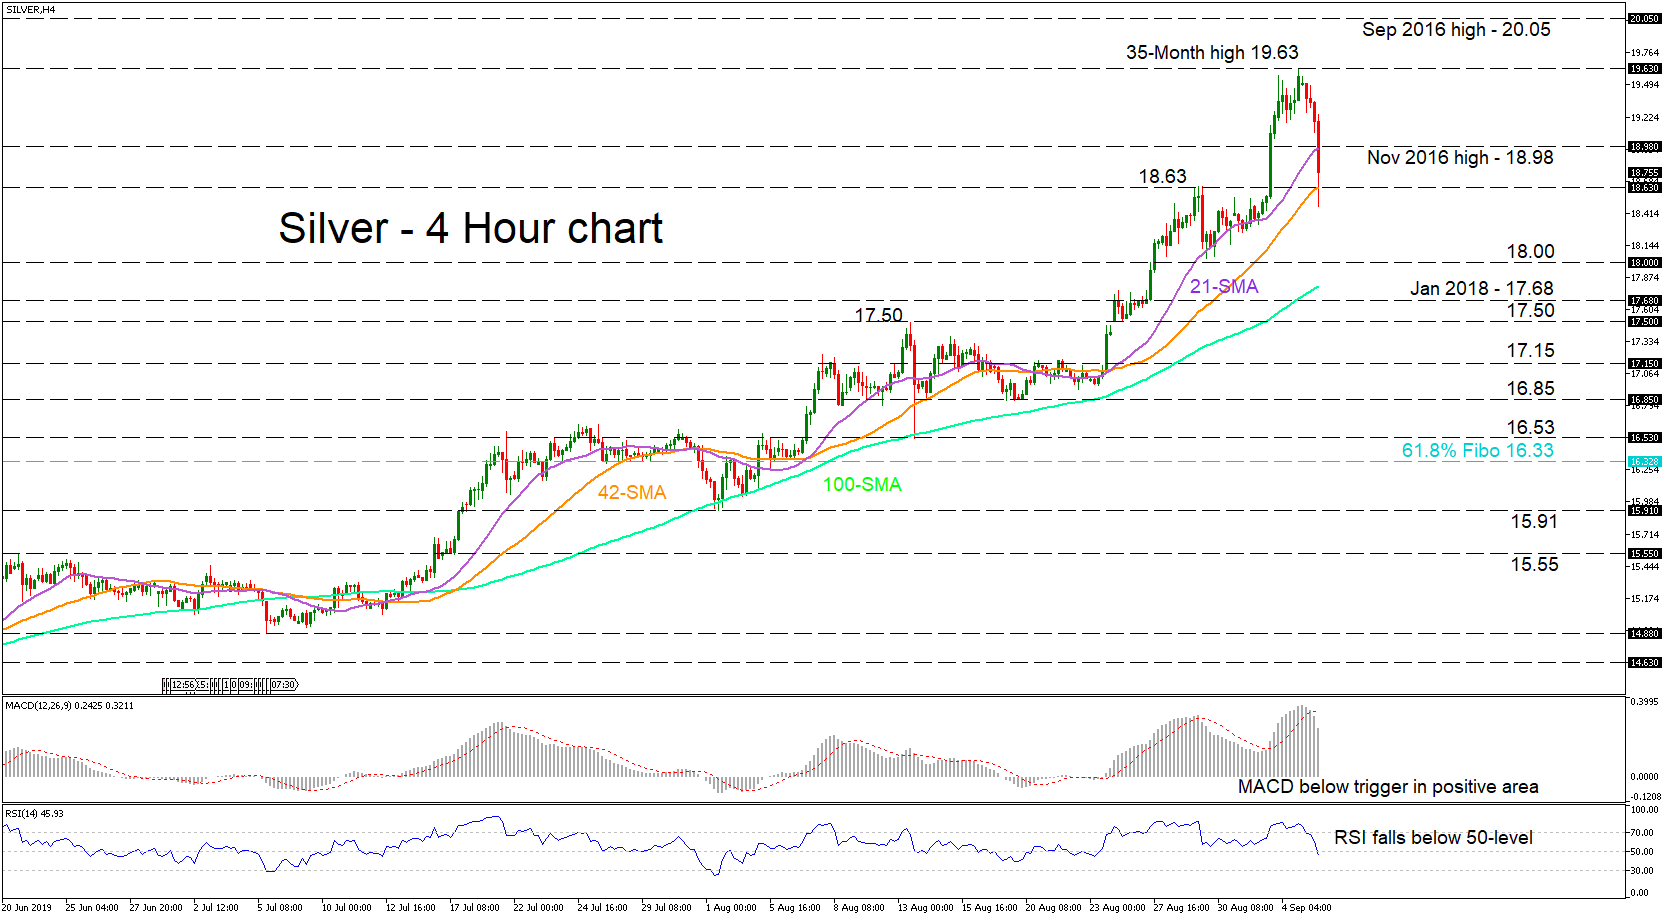
Posted on September 5, 2019 at 3:54 pm GMT

Silver’s bears erased the gains from the move up to a thirty-five-month high of 19.63. The pullback in the price of the metal moved through the 21-period simple moving average (SMA), which coincided with support from the November 2016 high of 18.98. The bears are now testing the 42-period SMA also residing with the swing high at 18.63. Momentum indicators reflect an increasing negative picture for the short-term. The MACD declined below its red trigger line in the positive region, [..]

post-image

Technical Analysis – Gold takes a time-out after new high

Posted on September 2, 2019 at 10:13 am GMT

The yellow metal clocked a new 6 ½-year high of 1555.10 on August 26 and then pushed into a transition period for around a week with upper and lower boundaries around 1547 and 1516 respectively. It’s worth mentioning that the Bollinger bands are also squeezed in this short-term pause in direction. The MACD and the RSI suggest that negative momentum has started to increase. The MACD currently beneath its red trigger line, has declined into the negative zone, while the [..]

post-image

Technical Analysis – Silver breaches 18.00 level; touches multi-year highs

Posted on August 28, 2019 at 2:25 pm GMT

Silver has been in a three-month rally from May 28. The metal surpassed the highs from the first months of 2018 as well as the 18.00 psychological number. The bulls continue to dominate, something also signaled by the momentum indicators’ bullish demeanor. The MACD is rising and distancing itself from its red trigger line in the positive territory, whilst the RSI despite moving further into the overbought region, has turned down. Although no clear reversal signals are apparent, caution for a short-term [..]

post-image

Technical Analysis – Copper futures stretch to new 2-year lows; bears to keep pressure

Posted on August 27, 2019 at 10:58 am GMT

Copper futures for December delivery softened under a well-established support area of 2.5300 (since 2017), extending the downward pattern to a new two-year low of 2.4952. Technically, the market could stay under pressure in the short-term as long as the MACD holds in negative area and under its red signal line, with the bearish RSI endorsing the view as well. Yet, the Stochastics’ bullish rebound in the oversold area suggests that upside corrections in the very short-term are possible. Traders could wait for a [..]

post-image

Technical Analysis – Gold gears to new highs; looks cautiously bullish in short-term

Posted on August 26, 2019 at 7:20 am GMT

Gold staged a quick rebound on Friday after failing to breach the 1,493 support area, while on Monday the yellow metal opened with a positive gap to hit an almost 6 ½-year high of 1,555. The red Tenkan-sen and the blue Kijun-sen completed a neutral phase and returned to the upside, capturing bullish pressures in the market. The positive momentum in the RSI and the MACD is another call for further improvement, though with the former being ready to enter [..]

post-image

Technical Analysis – WTI oil futures recent rally retests the 200-SMA

Posted on August 20, 2019 at 8:49 am GMT

WTI oil futures collapsed back down to the lower boundary of the nearly three-month trading range, registering a seven-month low of 50.51, before the bulls rallied back up to the 200-period simple moving average (SMA) on the four-hour chart. The MACD and the RSI are also indicating some weakness but suggest a positive directional momentum is still in place. They are both in the positive region with the MACD above its red trigger line and the RSI slowly creeping higher [..]

post-image

Technical Analysis – Gold slips below 50-SMA; risk leans towards negative

Posted on August 19, 2019 at 8:57 am GMT

Gold has only been focused on making new peaks as it logged a new 6-year and four-month high of 1534.91. The metal corrected to the downside after the high on August 13 but the 50-period simple moving average (SMA) in the four-hour chart managed to limit the negative movement. The MACD and the RSI are indicating that the positive directional momentum is decreasing as the MACD is underneath its red trigger line, nearing zero, whereas the RSI has moved slightly [..]

post-image

Technical Analysis – Silver meets 2018 peaks; bias neutral-to-bearish

Posted on August 16, 2019 at 10:12 am GMT

Silver topped near its 2018 peaks this week before pulling slightly back, with the MACD and the RSI pointing now to a neutral-to-bearish mode in the short-term; the former is increasing negative momentum below its red signal line, while the latter is fluctuating slightly below its 50 neutral mark. The support area around the 23.6% Fibonacci of 16.90 of the upleg from 15.03 to 17.49 will be closely watched if the decline extends. In case of a sharper downside move, the 38.2% Fibonacci and [..]

post-image

Technical Analysis – Copper futures fail to close below 2.54; move back sideways

Posted on August 13, 2019 at 3:24 pm GMT

 Copper futures were unable to close below the 2.54 hurdle, and the bulls logged gains, sending the metal back into the neutral sideways market that has lasted for three months. The momentum indicators suggest the short-term negative trend is weakening. The MACD has started to turn up in the negative area for a cross above its trigger line, while the ADX shows a weakening of the bearish trend in place. The simple moving averages (SMAs) although bearish have flattened in [..]

post-image

Technical Analysis – WTI oil futures spike up, but still cautiously negative

Posted on August 13, 2019 at 2:06 pm GMT

WTI oil futures for September delivery have recovered some ground in recent days, but the broader picture remains cautiously negative from a technical standpoint, as the price action still consists of lower highs and lower lows. That said, a break below 50.50 is required to signal that the bigger downtrend is back in force. If the sellers retake the reins, their first obstacle may be the 50.50 zone, where a downside break would mark a lower low on the daily [..]

Risk Warning: Your capital is at risk. Leveraged products may not be suitable for everyone. Please consider our Risk Disclosure.