XM does not provide services to residents of the United States of America.

commodities

post-image

Technical Analysis – Gold shines near six-year high; rally could stall but not end

Posted on June 24, 2019 at 9:13 am GMT

Gold bulls got extra energy on Friday, driving the price towards an almost six-year high of 1,411. Downside corrections are likely in the very short term as the stochastics are set for a bearish cross above 80 overbought mark. The MACD however, has yet to show any sign of weakness, an indication that any slowdown in the market may be short-lived. Slightly higher, the 50% Fibonacci ratio of 1,421 of the three-year old downleg from 1,796 to 1,046 could prove a trigger point for another bullish [..]

post-image

Technical Analysis – Silver pulls back from 3-month high

Posted on June 21, 2019 at 11:47 am GMT

Silver reversed to the downside early on Friday but the 20-period simple moving average (SMA) in the four-hour chart managed to halt the bearish correction as it did a few days ago. The RSI and the MACD lost momentum as well, endorsing the negative move in the price. Yet, as long as both indicators remain in bullish area – the former above 50 and the latter above its red signal line – chances for a sharp downfall are weak. The 23.6% Fibonacci of 15.24 of the 14.27-15.43 upleg [..]

post-image

Technical Analysis – WTI oil futures rally to 3-week high after breaking 50% Fibo

Posted on June 20, 2019 at 1:49 pm GMT

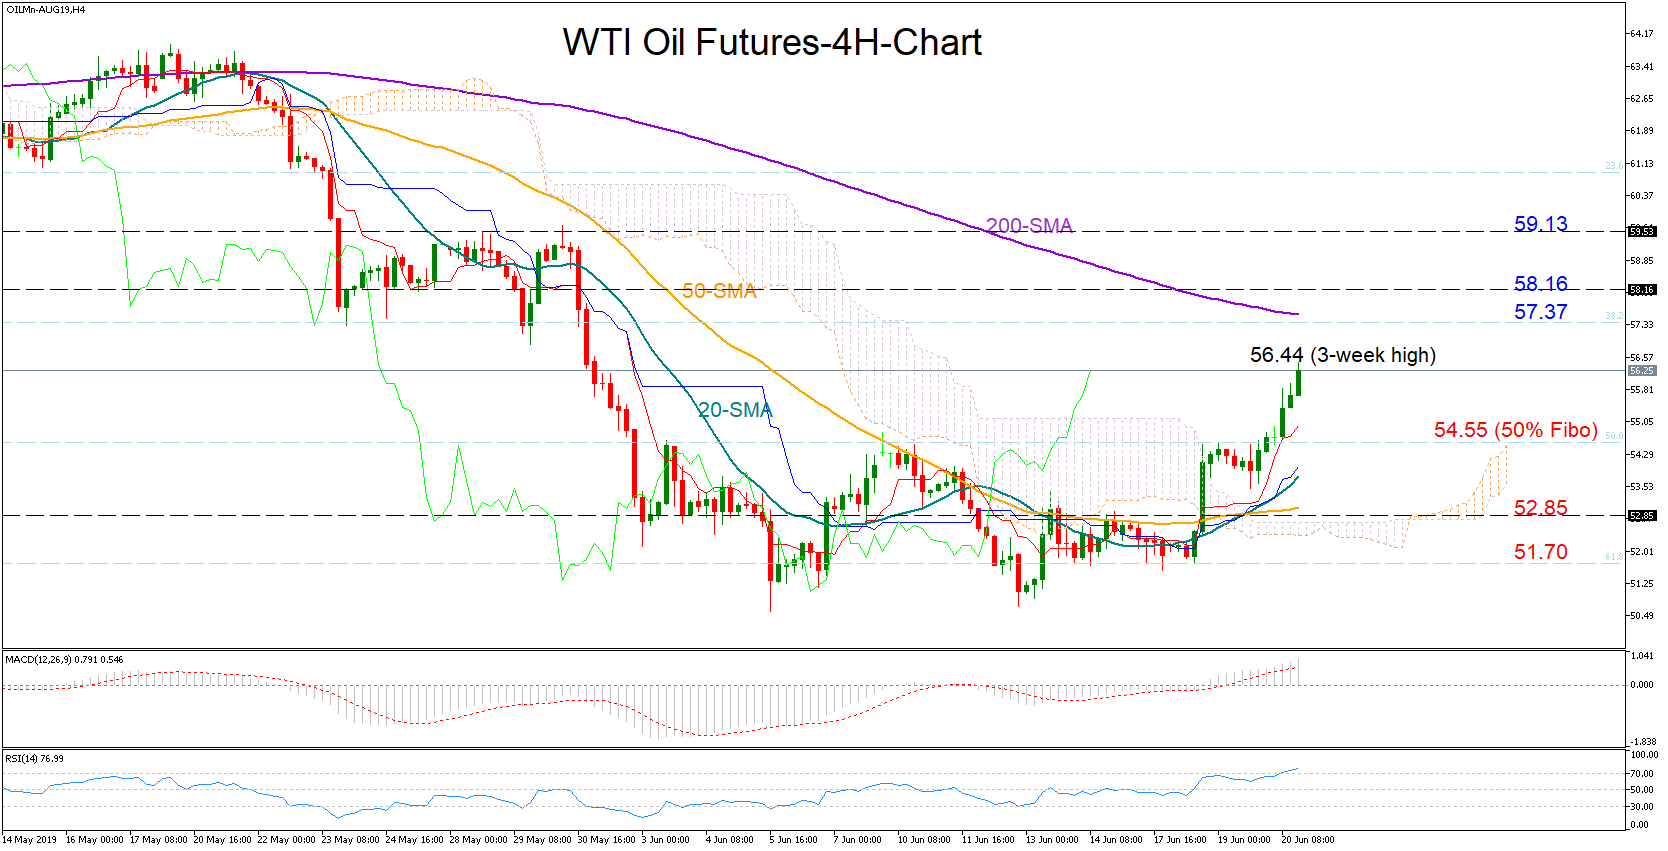
WTI oil futures for August delivery managed to break resistance around the 50% Fibonacci of the 42.53-66.57 upleg and pick up steam towards a new three-week high of 56.33 on Thursday. However, buyers would like to see prices running above the 38.2% Fibo of 57.37 and the 200-period simple moving average (SMA) in the four-hour chart to put faith in the recent rally.  Should the MACD and the red Tenkan-sen continue sloping upwards such a case may occur in the near-term. Slightly up, [..]

post-image

Technical Analysis – WTI futures lack clear direction in short-term; medium-term downtrend intact

Posted on June 11, 2019 at 9:15 am GMT

WTI crude oil futures are rising above the bullish cross within the 20- and 40-simple moving averages (SMAs) but are still hovering below the Ichimoku cloud in the 4-hour chart. The downside momentum appears to have run out of steam as the stochastic oscillator is returning higher while the RSI is trying to gain ground above the neutral threshold of 50. Should oil prices manage to strengthen the slightly bullish retracement the next resistance could come around the 23.6% Fibonacci [..]

post-image

Technical Analysis – Brent futures return up but find obstacle at 40-SMA

Posted on June 7, 2019 at 8:38 am GMT

Brent crude oil futures has gained a little extra this week to jump above the 20-period simple moving average (SMA) and re-challenge the 40-SMA. The technical indicators are currently feeding prospects for a possible positive short-term trading as the RSI is holding above 50 level, while the MACD continues to strengthen above its trigger line. However, the stochastic oscillator is flagging overbought conditions, as it fluctuates above 80 with a softer positive slope. A failure to overcome the 62.80 resistance, could send the price down to the 20-SMA currently at 61.40 in the 4-hour chart. [..]

post-image

Technical Analysis – WTI futures hovers above 4-month low; bearish bias may run out of steam

Posted on June 4, 2019 at 7:06 am GMT

WTI crude oil futures declined considerably towards a fresh four-month low of 52.11 on Monday, erasing the medium-term ascending movement in the daily chart. However, the downside momentum appears to have run out of steam as prices have been attempting and failing to close below the 61.8% Fibonacci retracement level of the upleg from 42.50 to 66.60 near 51.74. The stochastic oscillator is returning higher in the oversold zone, while the RSI is trying to gain ground below the 30 [..]

post-image

Technical Analysis – Gold advances considerably towards 2-month high

Posted on June 3, 2019 at 9:47 am GMT

Gold prices have been in a flying mode over the last couple of days, hitting a new two-month high around 1,315. The yellow metal jumped above the Ichimoku cloud and the 23.6% Fibonacci retracement level of the upleg from 1,160 to 1,346.61, near 1,302 as well as above the 1,310 barrier. The RSI and the stochastic oscillator signal that room for improvement is limited as the former is approaching the 70 overbought mark and the latter is rising above the 80 level in the daily timeframe. Yet the [..]

post-image

Technical Analysis – Copper futures records new low; bias still bearish

Posted on May 31, 2019 at 12:05 pm GMT

Copper futures with delivery on July 2019 are declining with strong momentum over the last three days below the 20- and 40-simple moving averages (SMAs) in the daily timeframe and recording a four-month low of 2.6260 today. The technical indicators are remaining in the bearish territory, with the RSI sloping down in the oversold zone and the MACD posting a bearish cross with its trigger line. In case the price extends the bearish move, immediate support is expected to come from the 2.5750 barrier, [..]

post-image

Technical Analysis – WTI crude futures build base above 2½-month trough

Posted on May 28, 2019 at 8:10 am GMT

WTI crude oil futures found strong support at a fresh two-and-half-month low of 57.40, where the 38.2% Fibonacci retracement level of the upward rally from 42.50 to 66.60 is standing. The price drifted below the ‘golden cross’ of the 50- and 200-simple moving averages (SMAs) in the daily timeframe, while the stochastic is raising chances for bullish correction at it created a positive cross within the %K and %D lines in the oversold zone. Should the price edge higher, positive [..]

post-image

Technical Analysis – Gold finds obstacle near 1,287; indicator suggest bearish bias

Posted on May 27, 2019 at 8:46 am GMT

Gold prices had another touch of the 1,287 resistance level today, remaining above the 23.6% Fibonacci retracement level of the descending movement from 1,346.60 to 1,266 near 1,285 and is standing within the Ichimoku cloud in the 4-hour chart. The RSI and the stochastic oscillator signal that the next move in the price is more likely to be on the downside as the former is negatively sloped above its 50 neutral mark and the latter continues to weaken slowly in the overbought zone, recording [..]

Risk Warning: Your capital is at risk. Leveraged products may not be suitable for everyone. Please consider our Risk Disclosure.