XM does not provide services to residents of the United States of America.

Commodities

post-image

Technical Analysis – Gold shines near six-year high; rally could stall but not end

Posted on June 24, 2019 at 9:13 am GMT

Gold bulls got extra energy on Friday, driving the price towards an almost six-year high of 1,411. Downside corrections are likely in the very short term as the stochastics are set for a bearish cross above 80 overbought mark. The MACD however, has yet to show any sign of weakness, an indication that any slowdown in the market may be short-lived. Slightly higher, the 50% Fibonacci ratio of 1,421 of the three-year old downleg from 1,796 to 1,046 could prove a trigger point for another bullish [..]

post-image

Technical Analysis – Silver pulls back from 3-month high

Posted on June 21, 2019 at 11:47 am GMT

Silver reversed to the downside early on Friday but the 20-period simple moving average (SMA) in the four-hour chart managed to halt the bearish correction as it did a few days ago. The RSI and the MACD lost momentum as well, endorsing the negative move in the price. Yet, as long as both indicators remain in bullish area – the former above 50 and the latter above its red signal line – chances for a sharp downfall are weak. The 23.6% Fibonacci of 15.24 of the 14.27-15.43 upleg [..]

post-image

Gold rides the ‘perfect wave’ higher – Special Report

Posted on June 21, 2019 at 10:57 am GMT

The world’s oldest safe haven recorded extraordinary gains lately, as the ‘perfect combination’ of falling interest rates, a declining dollar, and general risk aversion amid recession and geopolitical fears fueled the rally. Given that these forces seem unlikely to abate anytime soon, the outlook for gold remains bright, with the key risk to this view being a potential trade ‘ceasefire’ that calms markets down. The global economy is clearly losing momentum, with uncertainty emanating from trade tensions holding back business [..]

post-image

Technical Analysis – WTI oil futures rally to 3-week high after breaking 50% Fibo

Posted on June 20, 2019 at 1:49 pm GMT

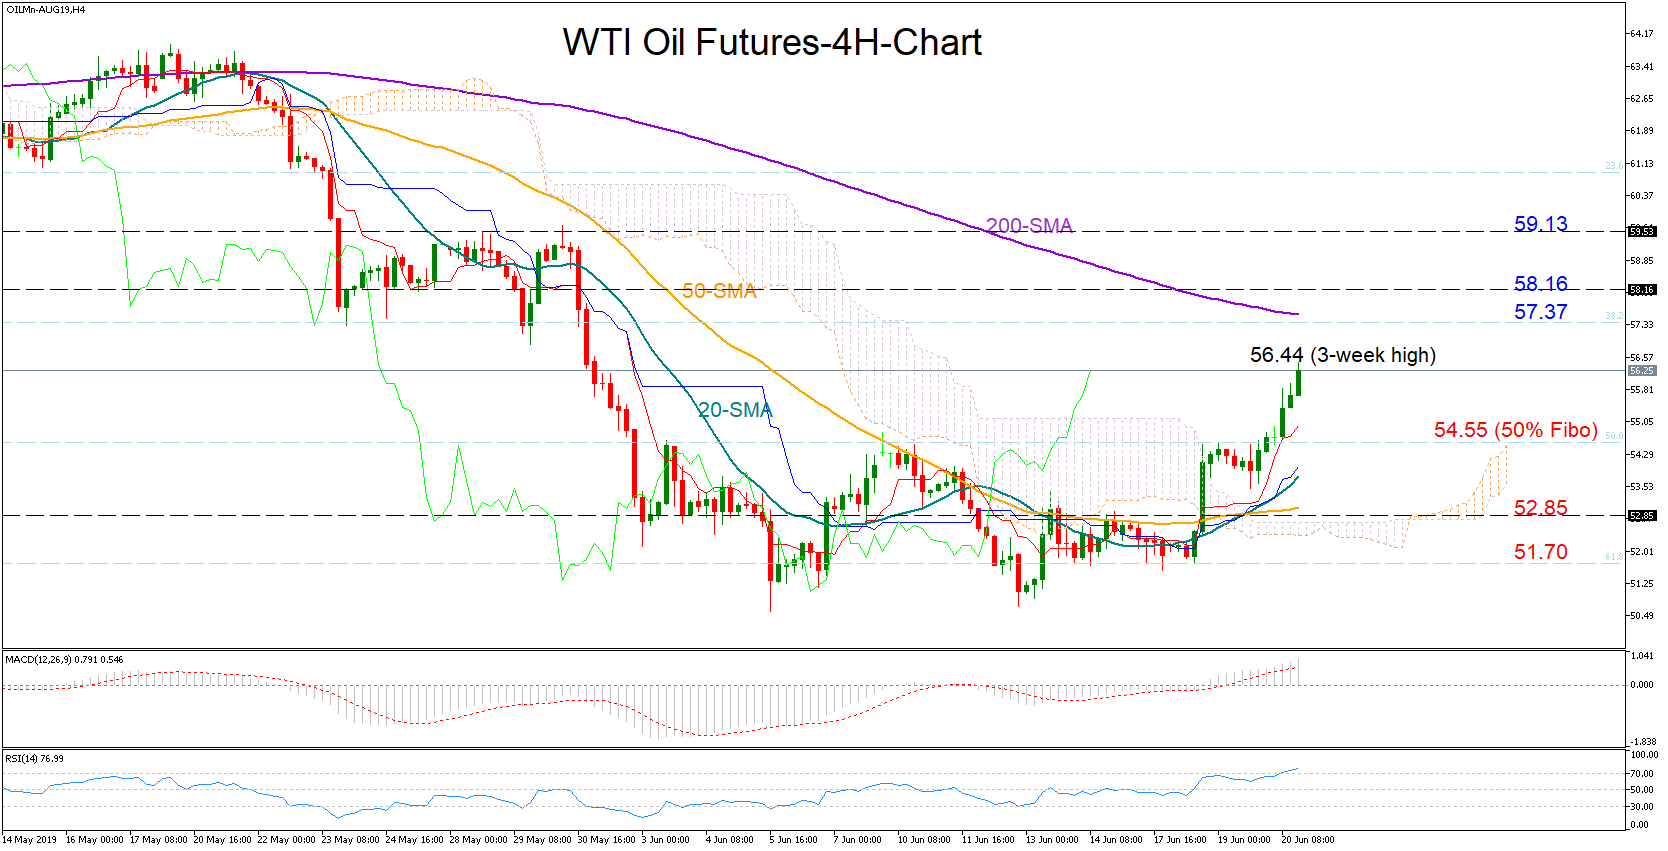
WTI oil futures for August delivery managed to break resistance around the 50% Fibonacci of the 42.53-66.57 upleg and pick up steam towards a new three-week high of 56.33 on Thursday. However, buyers would like to see prices running above the 38.2% Fibo of 57.37 and the 200-period simple moving average (SMA) in the four-hour chart to put faith in the recent rally.  Should the MACD and the red Tenkan-sen continue sloping upwards such a case may occur in the near-term. Slightly up, [..]

post-image

Technical Analysis – Gold spikes to 14-month highs; could gain more

Posted on June 18, 2019 at 2:16 pm GMT

Gold bulls took over again on Tuesday, driving the price near Friday’s 14-month high of 1,358. The location of the RSI – above 70 – hints that the bullish action may be overdone, and therefore no space is left for additional upside. However, with the Stochastics trending under the 80 oversold level and the MACD strengthening momentum above its red signal line, the market may see further improvement before potentially reversing lower. The 1,356-1,365 area is the next target, while slightly higher the 2016 peak of [..]

post-image

Technical Analysis – Copper futures attempt to break above descending channel

Posted on June 12, 2019 at 2:12 pm GMT

Copper futures for July delivery have unsuccessfully attempted to pierce the upper boundary of the one-month old descending channel (2.695) on Tuesday. The positive momentum in the MACD signals that upside pressures may return in the short-term, but the price may first need to crawl comfortably above 2.711, the 61.8% Fibonacci retracement of the 2.539-2.991 bullish wave, to fuel a stronger buying interest. On the way up, the 50% Fibonacci and the 200-day simple moving average (SMA), could hostage the bulls. If not, then the 38.2% Fibonacci of 2.818 could [..]

post-image

Technical Analysis – WTI futures lack clear direction in short-term; medium-term downtrend intact

Posted on June 11, 2019 at 9:15 am GMT

WTI crude oil futures are rising above the bullish cross within the 20- and 40-simple moving averages (SMAs) but are still hovering below the Ichimoku cloud in the 4-hour chart. The downside momentum appears to have run out of steam as the stochastic oscillator is returning higher while the RSI is trying to gain ground above the neutral threshold of 50. Should oil prices manage to strengthen the slightly bullish retracement the next resistance could come around the 23.6% Fibonacci [..]

post-image

Technical Analysis – Gold turns overbought near former key resistance

Posted on June 10, 2019 at 8:30 am GMT

Gold recorded its best weekly performance so far this year, topping near a former key resistance of 1,346 on Friday. The RSI and the Stochastics, however, indicated that the bulls are exhausted as the measures peaked in overbought territory – letting the bears take over on Monday. Yet, with the 20-day simple moving average (SMA) increasing its distance above the 50-day SMA, the positive market trend may likely extend forward in the short-term. Should the market close comfortably below the 1,320 level, the bearish action may extend towards the upper surface of the Ichimoku cloud and the 23.6% [..]

post-image

Technical Analysis – Brent futures return up but find obstacle at 40-SMA

Posted on June 7, 2019 at 8:38 am GMT

Brent crude oil futures has gained a little extra this week to jump above the 20-period simple moving average (SMA) and re-challenge the 40-SMA. The technical indicators are currently feeding prospects for a possible positive short-term trading as the RSI is holding above 50 level, while the MACD continues to strengthen above its trigger line. However, the stochastic oscillator is flagging overbought conditions, as it fluctuates above 80 with a softer positive slope. A failure to overcome the 62.80 resistance, could send the price down to the 20-SMA currently at 61.40 in the 4-hour chart. [..]

post-image

Technical Analysis – WTI futures hovers above 4-month low; bearish bias may run out of steam

Posted on June 4, 2019 at 7:06 am GMT

WTI crude oil futures declined considerably towards a fresh four-month low of 52.11 on Monday, erasing the medium-term ascending movement in the daily chart. However, the downside momentum appears to have run out of steam as prices have been attempting and failing to close below the 61.8% Fibonacci retracement level of the upleg from 42.50 to 66.60 near 51.74. The stochastic oscillator is returning higher in the oversold zone, while the RSI is trying to gain ground below the 30 [..]

Risk Warning: Your capital is at risk. Leveraged products may not be suitable for everyone. Please consider our Risk Disclosure.