XM does not provide services to residents of the United States of America.

Commodities

post-image

Technical Analysis – Gold retains ascending channel; looks neutral in short-term

Posted on September 23, 2019 at 7:17 am GMT

Gold managed to close slightly positive and above the 1,500 mark last week thanks to Friday’s rebound which found support around the bottom of the 4 ½-month old ascending channel. In the short-term, the precious metal could follow a sideways path as long as the RSI holds around its 50 neutral mark and the MACD fluctuates near its red signal line. Besides the lower boundary of the channel, traders will be closely watching the 1,485 handle where the market seems [..]

post-image

Oil price retreat a relief for global economy; are more shocks on the way? – Commodity News

Posted on September 19, 2019 at 3:07 pm GMT

The world experienced its biggest oil price shock since the 1991 Gulf War this week after Saudi Arabian oil facilities came under fire from suspected Iranian drone and missile strikes on Saturday. The attack shut down about 50% of Saudi Arabia’s daily oil production, amounting to 5% of global supply, sending prices soaring by more than 20% in the immediate aftermath. But as the United States appears to be reluctant to engage in a military conflict with Iran and calm [..]

post-image

Technical Analysis – WTI gaps higher and breaks upper boundary

Posted on September 17, 2019 at 10:11 am GMT

WTI oil futures’ steam cooled after a fierce move led to a break above the upper boundary of the three-and-a-half-month sideways market, with the price of the commodity already starting to consolidate again. The price had gapped above the simple moving averages (SMAs), which now paint a positive picture, with their bullish cross. The stall in the price is also reflected in the momentum indicators, as they show positive momentum has calmed. The MACD, although having inclined above its red [..]

post-image

Technical Analysis – Palladium futures push to a new all-time peak

Posted on September 16, 2019 at 3:36 pm GMT

Palladium futures plotted a new all-time high of 1617.03 as the bulls surpassed the previous peaks from March 21 and July 11. However, the sellers have emerged and have frozen all short-term efforts of a climb higher, something which is also reflected in the momentum indicators. The MACD although in positive areas and above its trigger line, has flattened out, while the RSI has deflected off the 70-level and heads down. Despite this, the bigger positive picture from the simple [..]

post-image

Technical Analysis – Brent futures soar, logging biggest intraday gains

Posted on September 16, 2019 at 2:42 pm GMT

Brent crude oil today gapped higher, propelling the commodity to levels not seen for three-and-a-half months. The price soared by 6.51 at the opening to reach a peak of 68.49, before black gold retraced down to 64.81, surrendering some of its gains. Yet, the bulls have resurfaced and revived the move up back above 65.52, which is the 23.6% Fibonacci retracement level of the up leg from 55.87 to 68.49. The momentum indicators reflect a short-term positive picture, as the [..]

post-image

Technical Analysis – Gold retraces to 23.6% Fibonacci; bounces off uptrend line

Posted on September 16, 2019 at 9:47 am GMT

Gold bounced off the uptrend line drawn from May 30, gapping above the 21-period simple moving average (SMA) and then was halted by the 50-period SMA. The metal had consolidated around the 1488 level, which is the 23.6% Fibonacci retracement of the up leg from 1266.20 to 1556.92, after dropping from a recent seventy-seven-month high of 1556.92 on September 4. The 100-period SMA has flattened suggesting the sideways move may extend. While also neutral, the MACD, just below the zero [..]

post-image

Technical Analysis – WTI oil futures ease volatility within symmetrical triangle

Posted on September 12, 2019 at 3:26 pm GMT

WTI oil futures for October delivery saw volatility drying up within the boundaries of a symmetrical triangle over the past four months. Any breakout at the lines of the triangle could determine the directional bias, though since the RSI and the MACD keep fluctuating around neutral levels, the current consolidation phase is likely to continue for now. A remarkable move above the downward resistance line and more importantly above the 50% Fibonacci of 59.81 of the downleg from 76.87 to 42.53 could [..]

post-image

Technical Analysis – Gold unable to lift 1,560 barrier; upward channel sustains confidence

Posted on September 9, 2019 at 7:33 am GMT

Gold gave up some ground after failing to cross the 1,560 border, with the sellers currently eyeing the 1,493 noisy support area as the technical indicators warn over a neutral-to-bearish session in the short-term; the RSI is attached at its 50 neutral mark following last week’s decline and the MACD continues to lose momentum below its red signal line. The market, however, keeps a positive trend inside an ascending channel and unless the price breaches it on the way down, any weakness could [..]

post-image

Technical Analysis – WTI oil futures test the 38.2% Fibonacci multiple times

Posted on September 6, 2019 at 2:16 pm GMT

WTI oil futures rallied from a seven-month low on August 7, but the gains were halted at 56.68 and around the 38.2% Fibonacci retracement level of the down wave from 66.57 to 50.58. After multiple failed attempts to close above the 56.68 resistance level over the last couple of weeks, the 20-, 50- and 200-day simple moving averages (SMAs) have converged, encapsulating the price of the commodity. More importantly, the bull’s endeavor, to move above the downward sloping 100-day SMA [..]

post-image

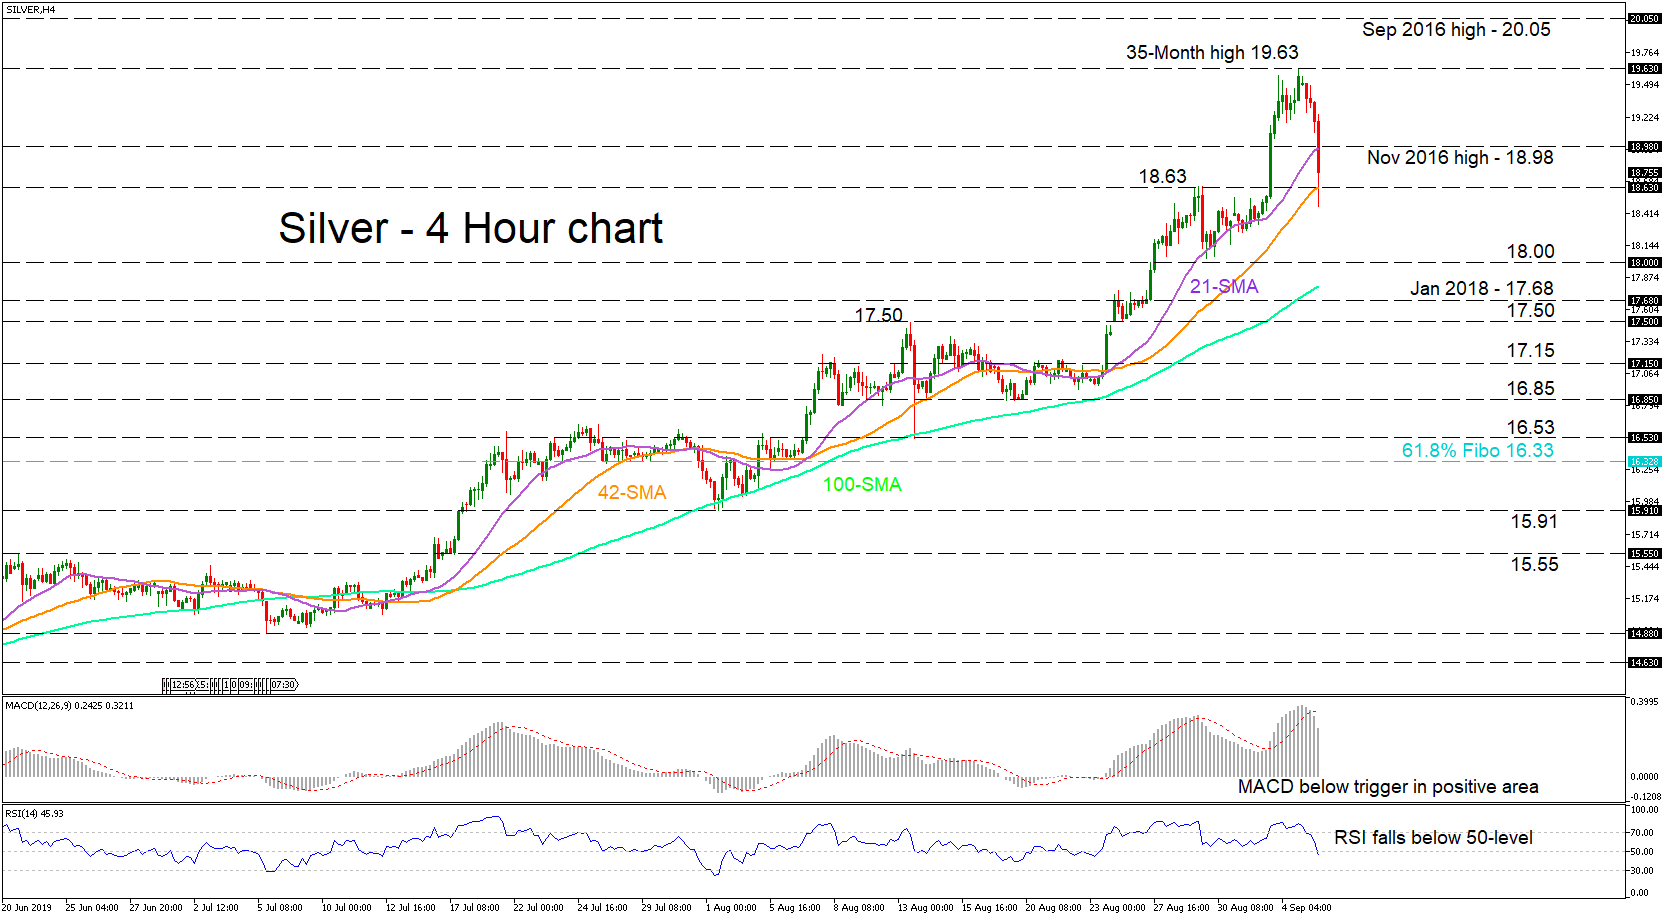
Technical Analysis – Silver moves to multi-year highs; bears correct back down

Posted on September 5, 2019 at 3:54 pm GMT

Silver’s bears erased the gains from the move up to a thirty-five-month high of 19.63. The pullback in the price of the metal moved through the 21-period simple moving average (SMA), which coincided with support from the November 2016 high of 18.98. The bears are now testing the 42-period SMA also residing with the swing high at 18.63. Momentum indicators reflect an increasing negative picture for the short-term. The MACD declined below its red trigger line in the positive region, [..]

Risk Warning: Your capital is at risk. Leveraged products may not be suitable for everyone. Please consider our Risk Disclosure.