XM does not provide services to residents of the United States of America.
Technical Analysis – Silver moves to multi-year highs; bears correct back down
Posted on September 5, 2019 at 3:54 pm GMTAnthony Charalambous, XM Investment Research Desk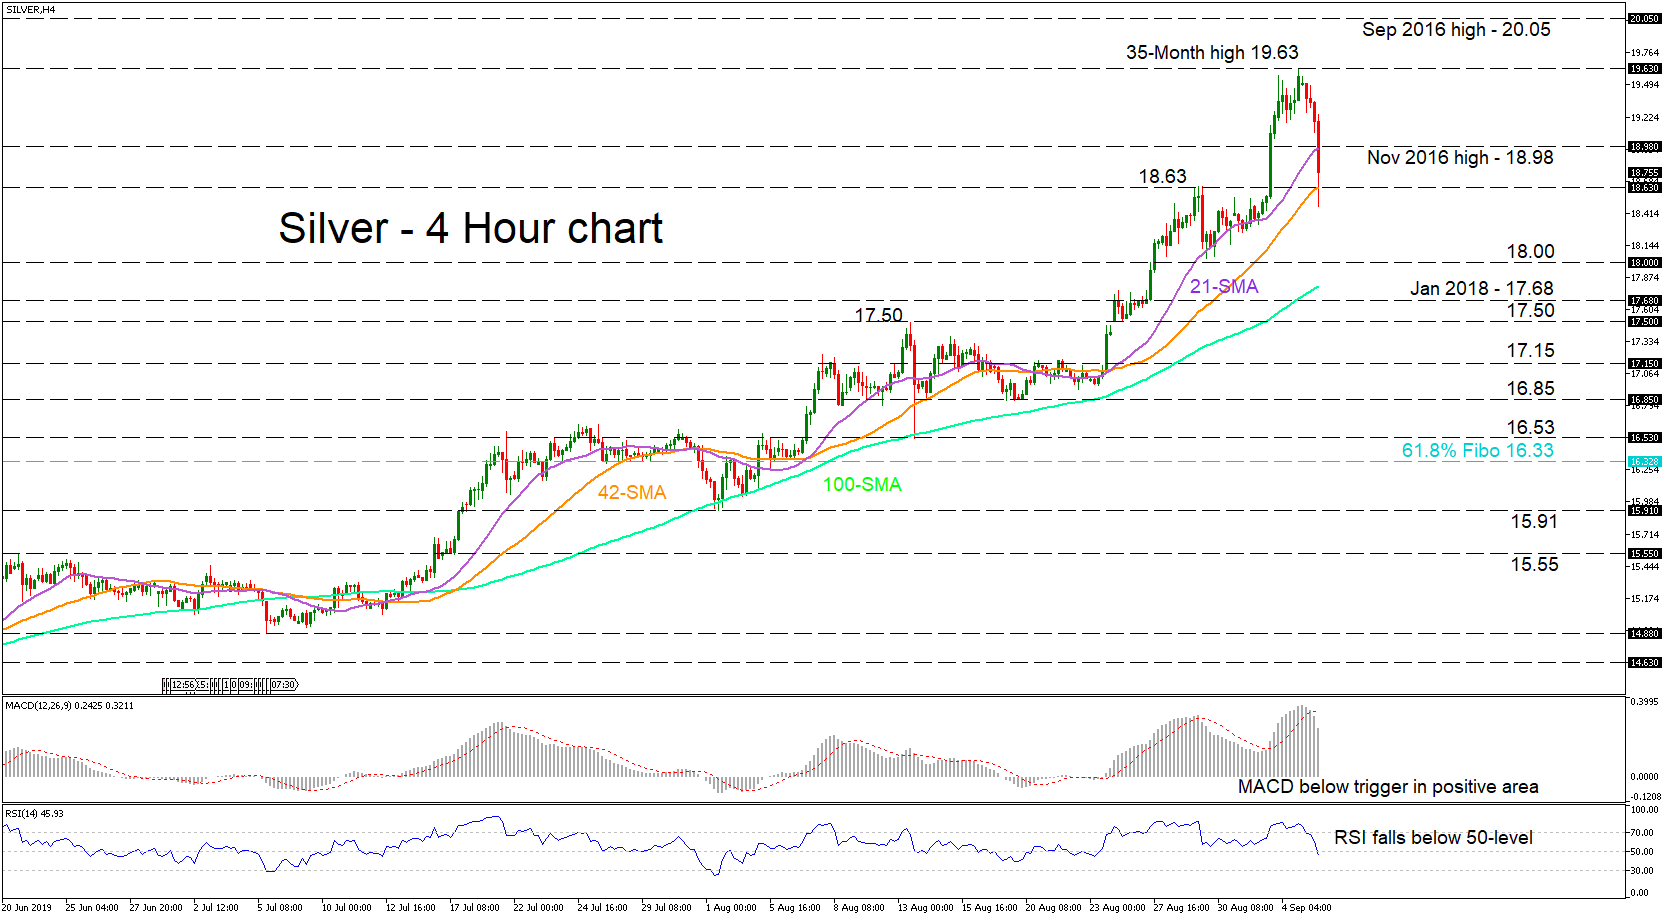
Silver’s bears erased the gains from the move up to a thirty-five-month high of 19.63. The pullback in the price of the metal moved through the 21-period simple moving average (SMA), which coincided with support from the November 2016 high of 18.98. The bears are now testing the 42-period SMA also residing with the swing high at 18.63.
Momentum indicators reflect an increasing negative picture for the short-term. The MACD declined below its red trigger line in the positive region, while the RSI fell underneath the 50-level and entered the bearish zone. Despite the correction unfolding, traders need to be aware of the persisting medium-term bullish bias.
If the bulls are resuscitated and the 42-period SMA and support of 18.63 holds, a shove north could initially test the resistance level of 18.98. If the buying endures a revisit of the thirty-five-month high of 19.63 could play out. If violated, a run up to the psychological 20.00 barrier takes focus, while higher the September 2016 high of 20.05 could also unfold.
If the bears manage to overtake the 18.63 level, the price could drop to test the 18.00 handle before the January 2018 level of 17.68. Declining further, the inside swing of 17.50 could stall the drop before reaching the more important support region of 17.15 – 16.85. A continued fall could see the 16.53 support level play out.
Overall, the precious metal’s medium-term positive picture prevails but should the downside correction deepen towards 16.85, the short-term picture would be at risk of turning bearish.
commodities silver
Latest Posts
Categories
- Commodities
- Cryptocurrencies
- CSR
- Daily Market Analysis
- Forex Previews
- Indices
- Special Reports
- Stock Market News
- Technical Analysis
- XM Group News
Investment Research